Global Distribution of Rainfall

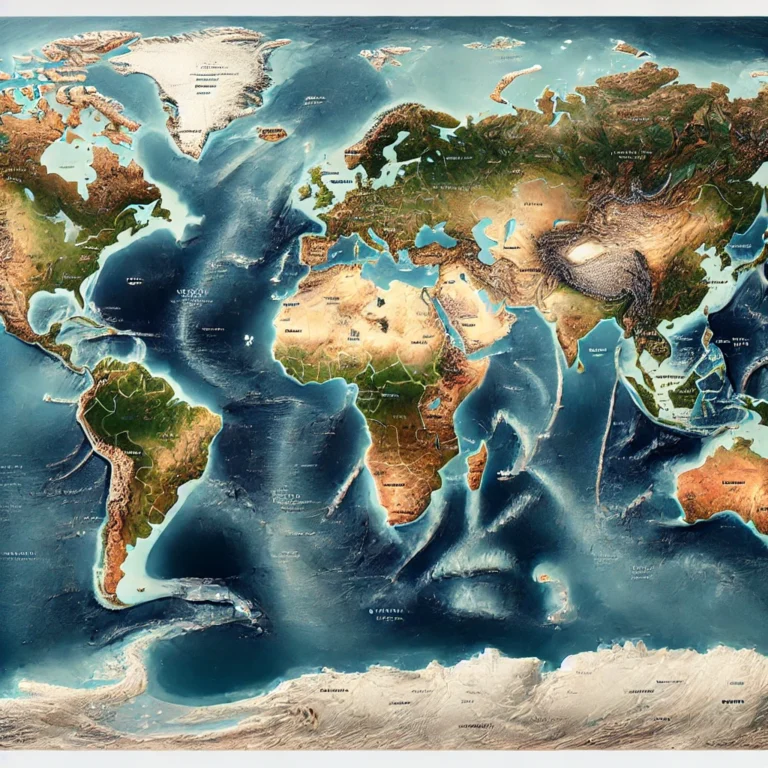
Rainfall is not evenly distributed across the globe. Some regions receive heavy and consistent rain throughout the year, while others remain dry for extended periods. This variation is due to multiple factors such as proximity to the sea, wind direction, mountains, and altitude. Let’s break down the distribution of rainfall worldwide and explore the different rainfall regimes that define the world’s climate patterns.
Global Rainfall Patterns 🌎
Average Global Rainfall
- The Earth’s mean annual rainfall is 970 mm, but this varies significantly across regions.
- Equatorial regions receive the highest rainfall, spread fairly evenly throughout the year.
- Hot deserts (tropical and subtropical) receive the lowest rainfall.
- Monsoon regions receive more than 80% of their annual rainfall in just four months.
Factors Influencing Rainfall Distribution
Several geographical and climatic factors determine where and how much rainfall occurs:
1️⃣ Nearness to the Sea 🌊
- Oceans are the primary source of moisture for rainfall.
- Coastal areas receive more rainfall due to the presence of moisture-laden winds.
2️⃣ Presence of Mountains ⛰️
- Mountains force moist air to rise, leading to orographic rainfall on the windward side.
- The leeward side remains dry, creating a rain shadow region.
3️⃣ Direction of Winds 🌬️
- Onshore winds (blowing from the sea) bring more moisture and cause rainfall.
- Offshore winds (blowing from land to sea) are dry and cause arid conditions.
4️⃣ Forests & Vegetation 🌳
- Forests trap clouds, increasing rainfall.
- Trees release moisture through transpiration, contributing to local precipitation.
5️⃣ Altitude 🏔️
- Higher altitude areas are cooler, causing clouds to condense and result in more precipitation.
- At very high altitudes, precipitation can fall as snow instead of rain.
Rainfall Regimes Across the World
Scientists Hurwitz and Austin identified six major rainfall regimes based on patterns of precipitation throughout the year:
1. Equatorial Rainfall Regime 🌍☔
- Rainfall occurs throughout the year with two peaks.
- Maximum rainfall occurs around:
- Vernal Equinox (March) 🌸
- Autumnal Equinox (September) 🍂
- Mostly convectional rainfall due to intense heating and rising moist air.
- Found between 5°N to 5°S (sometimes extending to 10°N to 10°S).
- 📍 Example: Amazon Rainforest, Congo Basin, Indonesia.
2. Tropical Rainfall Regime 🌴
- One peak of rainfall annually.
- Maximum precipitation occurs in the eastern part of continents.
- 📍 Example: Eastern Brazil, Eastern Australia.
3. Monsoonal Rainfall Regime 🌧️
- Heavy rainfall between June and September due to monsoon winds.
- Rainfall occurs mainly due to southwest monsoon and tropical depressions.
- Most rains are orographic and cyclonic in nature.
- 📍 Example: South Asia (India, Bangladesh), Southeast Asia.
4. Mediterranean Rainfall Regime 🌿🌞
- Winter rainfall occurs due to the southward movement of westerlies.
- Summers are dry.
- 📍 Example: Southern Europe (Italy, Spain), California, Western Australia.
5. Continental Rainfall Regime 🌄
- Maximum rainfall in summer due to convectional heating.
- Winters are dry due to anticyclonic conditions.
- 📍 Example: Central Asia, Central USA (Great Plains), Mongolia.
6. Maritime Rainfall Regime 🌊🌦️
- Temperate oceanic regions receive maximum rainfall in winter due to cyclonic activity.
- Found on the western margins of continents in middle latitudes.
- 📍 Example: Western Europe (UK, France), Pacific Northwest USA (Seattle), Chile.
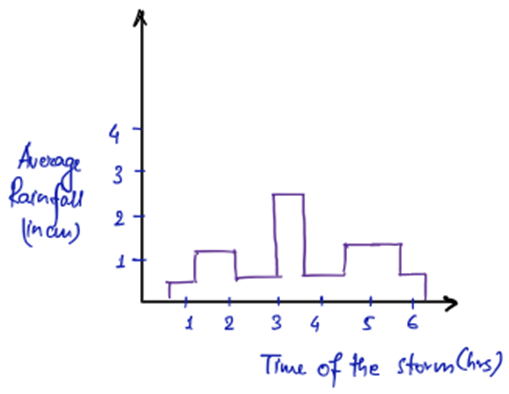
Understanding Rainfall Through Hyetographs 📊
What is a Hyetograph?
A hyetograph is a graphical representation of rainfall intensity over time during a storm.
How is it Created?
- It is plotted based on rainfall data from different stations within a drainage basin.
- Two common methods used:
- Thiessen Polygon Method – Divides the region into polygons to estimate average rainfall.
- Isohyet Method – Uses contour lines to show areas of equal rainfall.
Why is a Hyetograph Important?
- Helps in flood prediction by showing the relationship between rainfall and peak flood levels.
- Used in hydrology for analyzing runoff patterns.
- Helps in designing dams, drainage systems, and flood control measures.
Conclusion 🌦️
Rainfall is not random—it follows specific patterns dictated by geography, climate, and atmospheric dynamics. From the torrential downpours of the Amazon to the dry deserts of Rajasthan, understanding global rainfall distribution is crucial for agriculture, water management, and climate studies.