
Trophic Levels
The word “trophe” means nourishment.
In any ecosystem, organisms are arranged in a hierarchical order based on who eats whom — these steps are called trophic levels.
⚙️ How Energy Flows:
- The flow of energy in an ecosystem is unidirectional — it always moves from the Sun → Producers → Consumers → Decomposers.
- At every step, some energy is lost as heat (as per the Second Law of Thermodynamics).
- That’s why energy keeps decreasing from one trophic level to the next.
Hence, beyond the fourth trophic level, the available energy becomes negligible — not enough to support more organisms.
👉 That’s why food chains are short, rarely extending beyond 4–5 levels.

🌱 Typical Trophic Levels:
| Trophic Level | Category | Examples |
|---|---|---|
| 1️⃣ | Producers (Autotrophs) | Green plants, algae |
| 2️⃣ | Primary Consumers (Herbivores) | Deer, rabbit, caterpillar |
| 3️⃣ | Secondary Consumers (Carnivores) | Frog, lizard, snake |
| 4️⃣ | Tertiary / Quaternary Consumers (Top Carnivores) | Eagle, tiger, human |
These levels are energy-linked:
Each one depends on the previous for food and passes energy to the next.
🌾 Food Chains
A food chain is simply the transfer of energy and nutrients from one organism to another, in a linear sequence of “who eats whom.”
Example:
Grasses → Grasshopper → Frog → Snake → Eagle
Here, each organism occupies a specific trophic level, and energy flows step by step along the chain.

🥬 Types of Food Chains
(a) Grazing Food Chain (GFC)
- Starts with living green plants as producers.
- Energy passes from producers → herbivores → carnivores.
Example (Terrestrial):
Grass → Caterpillar → Lizard → Snake
Example (Aquatic):
Phytoplankton → Zooplankton → Fish → Pelican
👉 Dominant in aquatic ecosystems, where most energy flow happens through living producers.
(b) Detritus Food Chain (DFC)
- Begins with dead and decaying organic matter (detritus).
- Decomposers (like bacteria, fungi, earthworms) break down this material and release nutrients back to the soil.
- Then predators feed on the detritivores.
Example:
Dead leaves → Earthworms → Frogs → Snakes → Hawks
👉 In terrestrial ecosystems, more energy flows through the detritus chain than the grazing chain.
Thus, nature runs two parallel energy highways —
one from living plants (GFC) and another from dead matter (DFC).
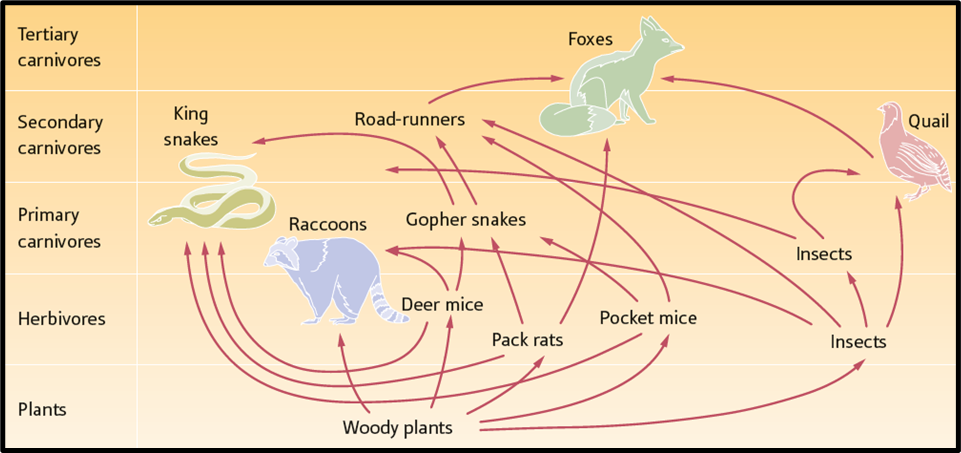
🕸️ Food Web
In reality, organisms don’t depend on just one food source.
A frog might eat both insects and worms; a snake might eat frogs, rats, or birds.
Hence, multiple food chains interconnect to form a food web.
Importance:
- Makes the ecosystem more stable and less vulnerable to disturbance.
- If one species disappears, others still find alternative food sources.
- Ensures continuous flow of energy through various routes.
🔄 Types of Biotic Interactions in a Food Web
Now, in this interconnected web, species interact constantly.
Their interactions can be negative, positive, or neutral, depending on whether they benefit, harm, or ignore each other.
Let’s go through them:
🔴 NEGATIVE INTERACTIONS
1. Amensalism (–, 0)
- One species is harmed; the other is unaffected.
- Example:
- Antibiosis – The fungus Penicillium secretes penicillin, which kills bacteria.
- A large tree shades a small plant — the small plant suffers (less sunlight), but the tree remains unaffected.
2. Predation (+, –)
- One species (predator) benefits; the other (prey) is harmed or killed.
- Examples: Tiger and deer, snake and frog.
- Ecological role: Predators maintain species diversity by preventing any one prey species from dominating.
3. Parasitism (+, –)
- The parasite lives in or on another organism (host), taking nourishment from it.
- Host is harmed but not always killed (since the parasite needs it alive).
- Examples:
- Tapeworms in humans
- Malarial parasite in red blood cells
- Bacteria, fungi, and viruses
💡 Note: The female mosquito is not a true parasite — it only visits the host temporarily to suck blood; it doesn’t live on or in the host.
4. Competition (–, –)
- Both species suffer because they compete for a common, limited resource (food, light, space, etc.).
- Example:
- Beetles and goats feeding on the same grass.
- Large tree overshadowing a small one — the small one loses sunlight, and though the large one remains mostly unaffected, both share the same niche.
Sometimes, competition may behave like a mild form of amensalism.
🟢 POSITIVE INTERACTIONS
1. Commensalism (+, 0)
- One species (commensal) benefits, while the other (host) is unaffected.
Examples:
- Suckerfish and shark – Suckerfish gets transport, protection, and leftover food; the shark remains unaffected.
- Epiphytic plants on trees – They get sunlight and support, without harming the host tree.
2. Mutualism (+, +)
- Both species benefit from the association.
- Example:
- Hermit crab and sea anemone – The anemone provides protection with its stinging cells; the crab provides food and transport.
- Coral and zooxanthellae algae – A perfect example of symbiosis (a permanent, intense form of mutualism). Both depend on each other completely.
⚪ NEUTRAL INTERACTION (0, 0)
Neutralism
- Neither species affects the other.
- True neutralism is rare in nature, because in a tightly connected ecosystem, almost every species influences another, directly or indirectly.
🧭 Summary Table – Biotic Interactions
| Interaction | Effect on Species 1 | Effect on Species 2 | Example |
|---|---|---|---|
| Amensalism | – | 0 | Penicillium vs. bacteria |
| Predation | + | – | Lion and deer |
| Parasitism | + | – | Tapeworm in human |
| Competition | – | – | Grass → goat vs beetle |
| Commensalism | + | 0 | Suckerfish with shark |
| Mutualism | + | + | Coral and zooxanthellae |
| Neutralism | 0 | 0 | Almost absent in real ecosystems |
🌎 Big Takeaway
- Energy flow in ecosystems is unidirectional, moving up trophic levels with decreasing efficiency.
- Food chains show a simple flow; food webs show real-world complexity.
- Biotic interactions define the relationships that bind ecosystems together — from predation to symbiosis.
In short, every organism is both a giver and a receiver in the grand cycle of life.
Nature works not in isolation, but in interdependence — and that’s the essence of ecology. 🌿
🏔️ Ecological Pyramids
Let’s begin with a simple idea:
In an ecosystem, organisms are arranged according to their trophic levels — from producers at the base to top consumers at the tip.
If we represent this in the form of a pyramid, we get what is called an Ecological Pyramid.
🧩 Definition:
“A graphic representation showing the number, biomass, or energy at each trophic level of an ecosystem.”
So, each horizontal bar in the pyramid shows one trophic level, and its length or width shows how much energy, mass, or number of organisms are present there.
At the base – producers (plants)
At the top – top carnivores (like eagles or tigers)
🌳 Three Types of Ecological Pyramids
- Pyramid of Numbers
- Pyramid of Biomass
- Pyramid of Energy (or Productivity)
Let’s explore each one 👇
Pyramid of Numbers – “How many organisms?”
This pyramid shows the total number of individuals at each trophic level.
It tells us how crowded each level is.
🔺 Upright Pyramid (Normal Case)
Seen in grassland and pond ecosystems —
where producers are numerous (many grass plants), and higher trophic levels become progressively fewer.
Example:
Grass (many) → Grasshoppers (few) → Frogs (fewer) → Snakes (very few) → Eagles (one or two)
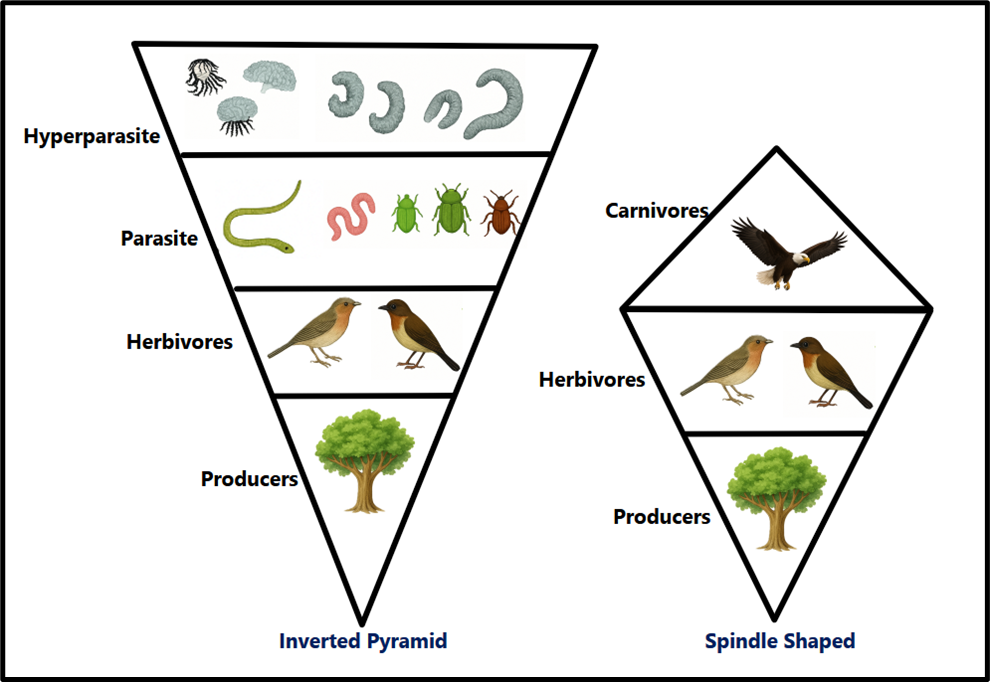
🔻 Inverted Pyramid (Exceptional Case)
Seen in a tree ecosystem —
One large tree (single producer) supports many herbivores (like birds, caterpillars, insects), and even more parasites on them.
So the number increases as we move upward — forming an inverted pyramid of numbers.
⚠️ Limitation:
Counting every single organism is nearly impossible, especially microorganisms, so this pyramid gives an approximate idea, not an exact one.
Pyramid of Biomass – “How much living matter?”
Here, instead of number of individuals, we measure the total dry weight of living organisms (their biomass) at each trophic level.
To make it scientific, ecologists often measure this in grams per square meter (g/m²) or kilograms per hectare (kg/ha) — this is called the standing crop.
🌳 Upright Pyramid of Biomass (Terrestrial Ecosystem)
In terrestrial ecosystems, this pyramid is upright because:
- Producers (plants) have the largest biomass.
- Herbivores eat a fraction of that.
- Carnivores have even less.
Example:
Forest → Herbivores (deer) → Carnivores (tiger)
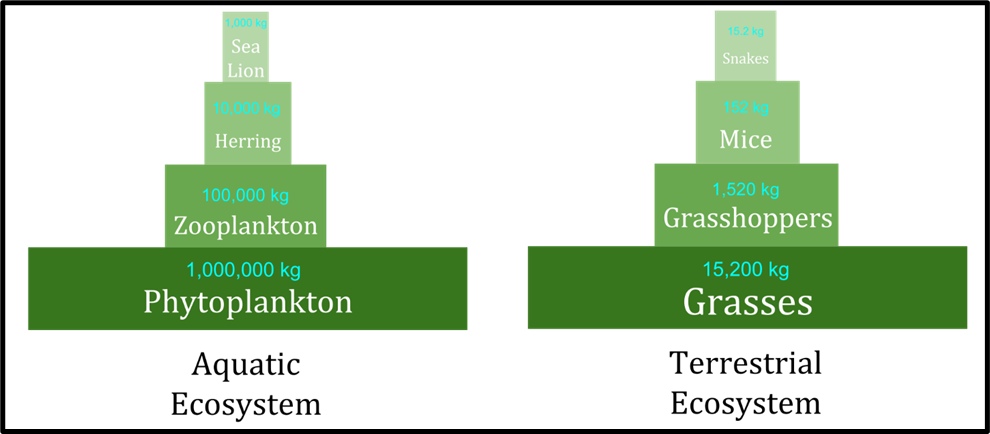
🌊 Inverted Pyramid of Biomass (Aquatic Ecosystem)
In aquatic ecosystems, the situation flips.
Here, phytoplankton (producers) are tiny but reproduce very fast.
At any moment, their total biomass is small — but they support a larger biomass of consumers like fishes.
So, the pyramid appears inverted:
Phytoplankton (small biomass) → Zooplankton → Fish (larger biomass at the top)
Note: Energy flow is still upward — only the snapshot of biomass appears inverted.

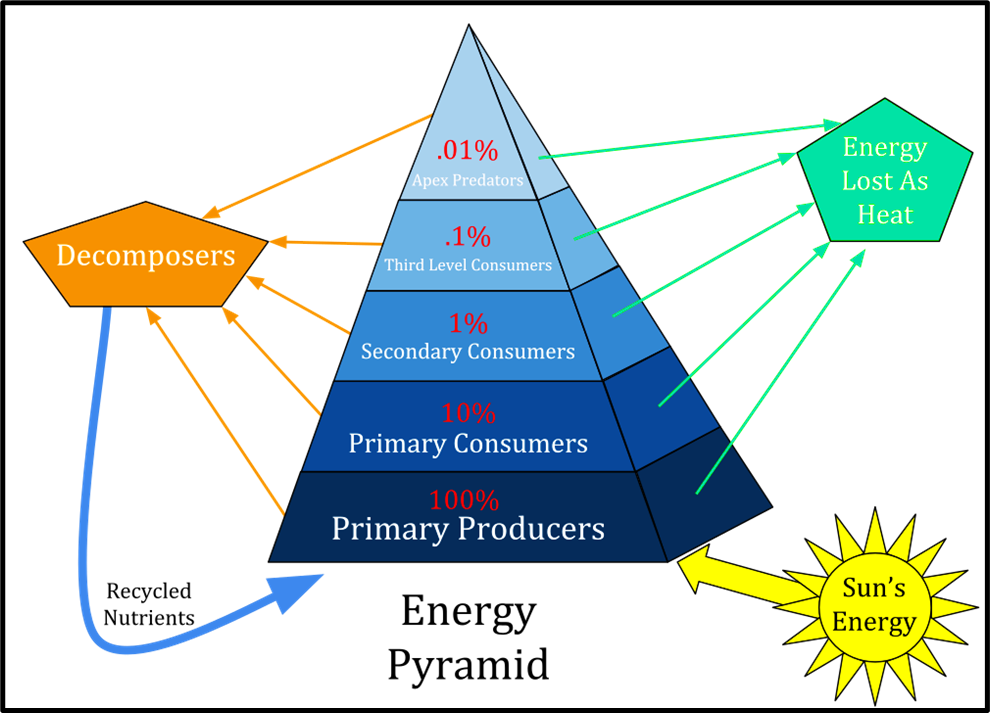
3️⃣ Pyramid of Energy – “How much energy flows upward?”
This is the most accurate and scientifically meaningful pyramid because it shows actual energy transfer at each trophic level.
Each bar represents energy content (in kcal or joules) in that trophic level per unit area per unit time.
🔺 Always Upright — Why?
Because energy always decreases as we move up due to:
- Respiration & metabolism losses at each level.
- Incomplete transfer (only a part of food is assimilated).
Thus, only a fraction of energy moves to the next level.
⚡ The 10% Law (Ecological Efficiency)
Proposed by Raymond Lindeman:
“Only about 10% of the energy available at one trophic level is transferred to the next.”
Example:
- Sunlight received = 1000 calories
- Plants capture → 100 cal (via photosynthesis)
- Herbivore stores → 10 cal
- Carnivore stores → 1 cal
Hence, usable energy drops by 90% at each step.
That’s why ecosystems rarely have more than four trophic levels.
🧠 Ecological Efficiency
It’s the ratio of energy transferred from one trophic level to the next.
It depends on how efficiently organisms:
- Capture energy
- Assimilate it
- Convert it into biomass
The lower the efficiency → shorter the food chain.
🧩 Why Energy Pyramid is Always Upright
Because energy cannot be recycled — once lost as heat, it’s gone.
Thus, total usable energy must decrease with each step.
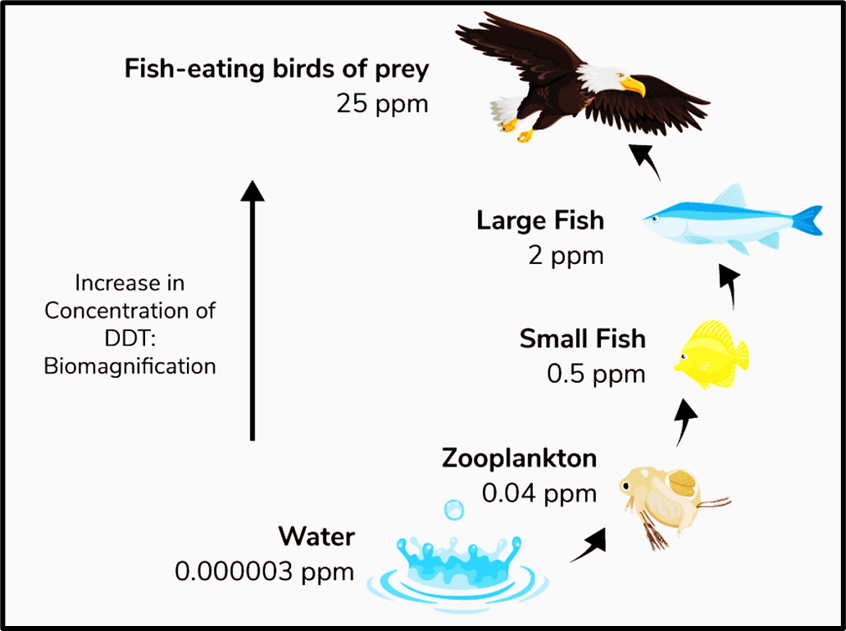
🌡️ Biological Magnification (Biomagnification)
While energy decreases upward, toxins increase upward — this is the irony of ecology!
Definition:
The tendency of non-degradable pollutants to become more concentrated in the bodies of organisms at higher trophic levels
⚗️ How It Happens – Step-by-Step
- Pollutant Entry (Bioaccumulation):
- Pollutants like DDT, PCBs, mercury enter the environment through pesticides or industry.
- They dissolve in fat, not water, so they cannot be excreted easily.
- They accumulate slowly in an organism’s tissues over time — this is bioaccumulation.
- Transfer Through Food Chain (Biomagnification):
- Small concentration in producers → higher in herbivores → highest in top carnivores.
- Example:
Water (0.000003 ppm DDT) → Plankton (0.04 ppm) → Small fish (0.5 ppm) → Large fish (2 ppm) → Fish-eating birds (25 ppm)
- Result:
- Predatory birds like eagles or ospreys lay thin-shelled eggs → fewer hatchlings → population decline.
🔬 Conditions for Biomagnification
- The pollutant must be:
- Non-degradable (cannot be broken by decomposers)
- Fat-soluble (stays in fatty tissues)
- Long biological half-life (stays for years)
That’s why DDT and chlorinated hydrocarbons are classic examples.
🧍♀️ Human Example:
- Pollutants get transferred through fish and dairy.
- Hence, human breast milk or animal milk is tested for fat-soluble toxins — since milk has high fat content.
⚠️ LIMITATIONS of Ecological Pyramids
- They show only a simple food chain, not the complex food web.
- They ignore organisms that belong to multiple trophic levels (e.g., humans).
- They completely exclude saprophytes and decomposers, though these are essential for nutrient cycling.
- They often provide a snapshot in time, not dynamic changes.
🧭 Concept Recap
| Pyramid Type | Measurement Basis | Common Shape | Ecosystem Example |
|---|---|---|---|
| Numbers | No. of individuals | Upright or Inverted | Grassland (upright), Tree ecosystem (inverted) |
| Biomass | Total dry weight | Upright (terrestrial) / Inverted (aquatic) | Forest, Pond |
| Energy | Energy flow (kcal/Joule) | Always Upright | All ecosystems |
🌍 Essence
- Energy flows upward, toxins accumulate upward.
- The pyramid of energy is the most reliable, while the others can vary based on ecosystem type.
- The concept of biomagnification reminds us how pollution doesn’t just spread — it intensifies as it climbs the food chain.
Nature’s design is efficient, but not infinite —
When humans disrupt the base of the pyramid, the whole structure above starts to crumble.
This topic is part of the complete Environment Notes for UPSC. Explore the full subject coverage here.