
World Energy Outlook Report 2025
Source: International Energy Agency (IEA), World Energy Outlook 2025
International Energy Agency (IEA)
- The IEA, an autonomous intergovernmental organisation, analyses data on energy use and requirements and provides policy recommendations and solutions to countries for sustainable energy growth.
- The IEA’s World Energy Outlook report, published annually, captures the world’s energy trends and transitions and predicts future trajectories.
World Energy Outlook Report 2025
Energy security in a volatile world
Why energy has become a national security issue
- Energy security now extends beyond oil & gas to include:
- Critical minerals (lithium, cobalt, rare earths)
- Electricity grids (cyber risks, weather shocks)
- Energy disruptions affect → Economic stability, Defence systems, Digital infrastructure (AI, data centres)
Present global contradictions
- Geopolitical instability exists alongside:
- Oil market surplus
- Subdued oil prices
- Countries adopt divergent strategies:
- Import-dependent nations → renewables & efficiency
- Resource-rich nations → traditional fuel security
📌 UPSC Angle:
Energy security is no longer just “fuel availability” → it is geopolitics + technology + supply chains.
Climate action losing momentum, risks rising
- 2024:
- Hottest year on record
- First year with global temperature >1.5°C above pre-industrial
- Despite this:
- Slower momentum on emissions reduction
- Weakening of international commitments
📌 UPSC Insight:
Mismatch between climate urgency and policy action → fertile ground for GS-III & Essay questions.
Global energy demand: still rising
- Renewables added at record pace (23rd consecutive year)
- Yet all fuels hit record highs: Oil, Natural gas, Coal, Nuclear
- Since 2019:
- Coal demand grew 50% faster than gas, mainly due to China
- Result:
- Energy-related emissions continue to rise
WEO scenario framework
Core Scenarios in WEO-2025
| Scenario | Meaning |
|---|---|
| CPS | Current Policies Scenario – only existing policies |
| STEPS | Stated Policies Scenario – includes announced but not fully implemented policies |
| NZE | Net Zero Emissions by 2050 – normative pathway |
| ACCESS | Universal electricity & clean cooking access |
📌 Note:
WEO scenarios are not forecasts, but decision-pathway tools.
Common Findings Across All Scenarios
Four structural shifts
- Energy security now depends on critical minerals
- Arrival of the “Age of Electricity”
- Shift in demand centre to India & emerging economies
- Rising role of renewables + comeback of nuclear
Critical Minerals: The New Energy Vulnerability
Key facts
- One country dominates refining of 19 out of 20 strategic energy minerals
- Average refining market share: ~70%
- Minerals critical for:
- EVs, batteries, power grids
- AI chips, defence systems, jet engines
- >50% of strategic minerals subject to export controls (as of Nov 2025)
Policy implication
- Market forces alone cannot diversify supply
- Requires:
- Strategic stockpiles
- New international partnerships
- Domestic processing capacity
📌 UPSC Link:
Critical minerals = Energy security + Strategic autonomy (India context).
Infrastructure Resilience & Climate Risks
- Energy disruptions affected 200 million households annually
- Causes:
- Droughts → hydropower & thermal output loss
- Floods, storms, wildfires → plant shutdowns
- 85% of incidents involved transmission & distribution grids
- All scenarios exceed 1.5°C by ~2030, diverging only after 2035
The Age of Electricity
Electricity demand growth
- CPS & STEPS: +40% by 2035
- NZE: +50% by 2035
Demand drivers
- Cooling (ACs)
- Electric mobility
- Data centres & AI
- Electrified heating & manufacturing
Investment trends
- Electricity supply + electrification = 50% of global energy investment
- Annual electricity generation investment: ~USD 1 trillion
- Grid investment: ~USD 400 billion (lagging badly)
📌 UPSC Insight:
Generation without grids → congestion, curtailment, blackouts.
Data Centres, AI & Energy
- Electricity use by data centres:
- Expected to triple by 2035
- Investment in data centres (2025):
- USD 580 billion (higher than oil supply investment)
- Concentration:
- USA, China, EU (>85% of additions)
- Strains already congested grids
Shift in Global Energy Demand Geography
- Post-China phase:
- Growth led by India, Southeast Asia, parts of Africa & Latin America
- By 2035:
- 80% of energy demand growth in high-solar-irradiation regions
- Explains:
- Rapid solar uptake
- Rising cooling demand
Renewables: Continued Rise
- Renewables grow fastest in all scenarios
- Solar PV leads
- China:
- 45–60% of global RE deployment
- Dominant manufacturer of solar panels & batteries
- Global surplus:
- Solar manufacturing capacity > 2× deployment
- Battery capacity ~3× deployment
📌 UPSC Angle:
China’s dominance → opportunity for affordability + concern for supply dependence.
Nuclear Power Comeback
- Nuclear included in strategies of 40+ countries
- >70 GW under construction (highest in 30 years)
- SMRs emerging:
- ~30 GW interest, mainly for data centres
- Global nuclear capacity to increase ~33% by 2035
Diverging Pathways for Fossil Fuels
Coal
- Future written in Asia
- STEPS & NZE → steady decline
- CPS → slower decline due to grid constraints
Oil
- Near-term surplus
- CPS requires 25 mb/d new supply by 2035
- EVs:
- 25% of new car sales in 2025
- 50% by 2035 (STEPS)
Natural Gas & LNG
- 300 bcm new LNG capacity by 2030
- US (~50%), Qatar (~20%)
- Likely LNG overhang (~65 bcm) in 2030
- India & South Asia absorb part due to affordability
Energy Access: A Development Priority
- 730 million people without electricity
- ~2 billion without clean cooking
- ACCESS Scenario:
- Universal electricity by 2035
- Clean cooking by 2040
- LPG main transition fuel for cooking
- ~80 million people/year gain electricity access to 2035
Emissions & Climate Outlook
- Energy-related CO₂ emissions (2024): 38 Gt (record)
- CPS → ~3°C warming by 2100
- STEPS → ~2.5°C
- NZE:
- 1.5°C overshoot inevitable
- Return below 1.5°C by 2100 via:
- Rapid transition
- Large-scale CO₂ removal (unproven)
Policy Options to Cut Emissions
- Scale-up renewables & nuclear
- Improve energy efficiency
- Reduce methane leaks
- Electrify end-use sectors
- Use hydrogen & CCUS where electrification is hard
- COP28 target:
- Tripling renewables by 2030
- Efficiency improvement target (4%) not met (currently ~2%)
UPSC Insights
- Energy security = fuel + minerals + grids + climate
- India emerges as future demand centre
- Electricity is the backbone of future energy systems
- Renewables dominate growth, but fossil fuels persist
- Grid investment & mineral diversification are decisive bottlenecks
- Policy choices today shape security, affordability & climate outcomes
India – Energy Outlook (WEO 2025)
India as the Global Engine of Energy Demand Growth
- India is the largest source of energy demand growth globally in the Outlook.
- In the STEPS (Stated Policies Scenario):
- Energy demand increases by >15 exajoules (EJ) by 2035
- This is almost equal to China + all Southeast Asia combined
- India’s contribution to global growth (to 2035):
- 1st in oil demand growth
- 2nd in electricity generation growth
- 2nd in coal demand growth
- 3rd in natural gas demand growth
📌 UPSC relevance:
India is no longer a marginal player but a system-shaping country in global energy markets.
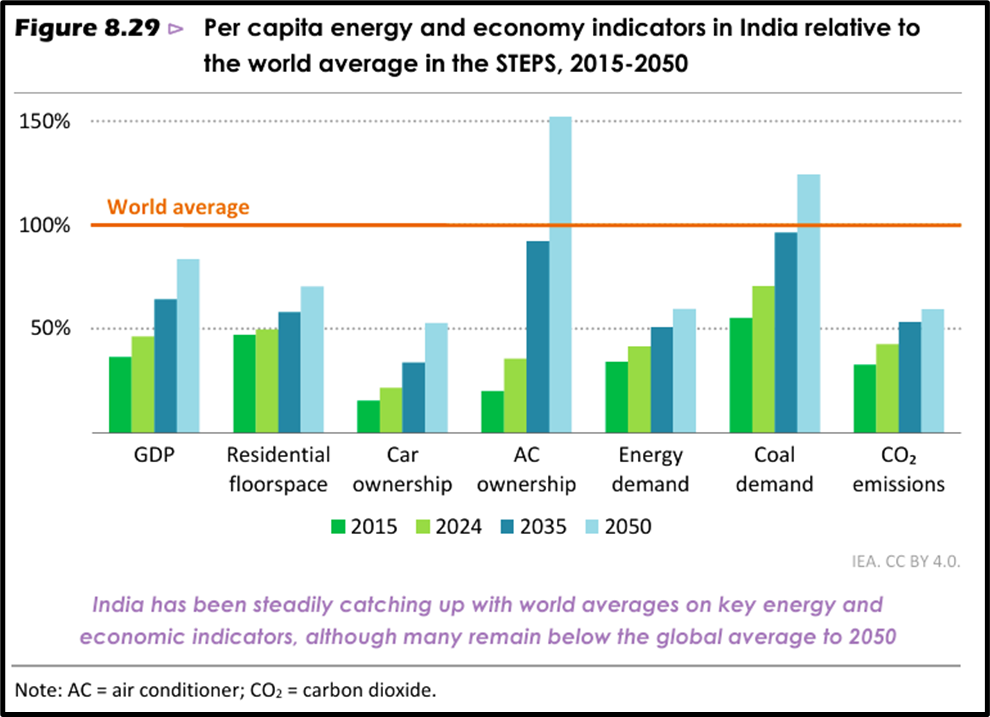
Economic & Demographic Drivers of Energy Demand
Growth fundamentals
- GDP growth (2010–2024): Second only to China
- Projected GDP growth (to 2035): 6.1% annually (highest among major economies)
- GDP per capita in 2035: ~75% higher than today
Structural transformation
- Urbanisation:
- India adds one Bangalore every year to its urban population (till 2035)
- Built environment:
- Floor space expands by 40%
- Mobility:
- ~12,000 cars added every day
- Cooling demand:
- >250 million air conditioners added over the next decade
📌 Insight:
India’s energy transition is driven not by luxury consumption but by basic development needs.
India’s Multiple Energy Challenges
India must simultaneously address:
- Universal access to modern energy
- Reduction in fossil-fuel import dependence
- Reliability of electricity supply
- Air pollution reduction
- Greenhouse gas (GHG) mitigation
Energy access
- Despite progress, ~20% of population still relies partly or fully on traditional biomass for cooking
- Pradhan Mantri Ujjwala Yojana:
- LPG subsidies for poor households
- Key clean-cooking intervention
Climate Commitments & Policy Direction
- Net Zero target: 2070
- Supporting measures:
- 50% non-fossil power capacity target by 2030
- Nuclear expansion to 100 GW by 2047 (from ~8 GW today)
- Carbon market for select industries from 2026
- Biofuels policy:
- 20% ethanol blending in petrol achieved in 2025
- Aimed at reducing oil imports
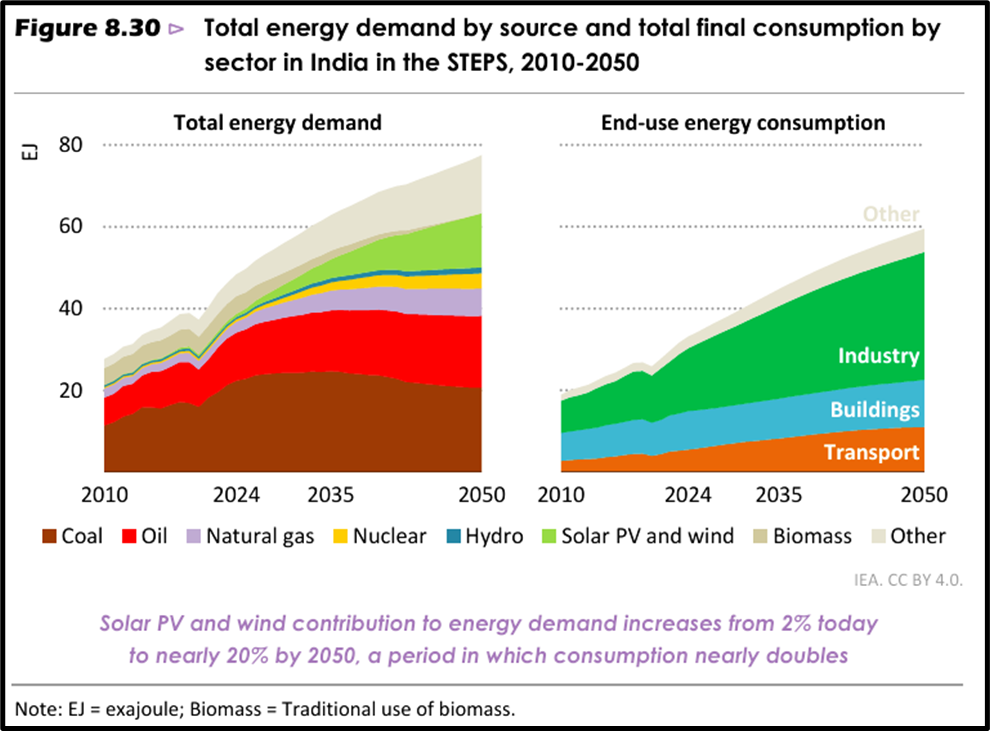
India’s Energy Mix in the STEPS
Long-term trends
- Solar PV and wind are the fastest-growing energy sources to 2050
- Together they reach ~20% of India’s total energy mix
- Coal and oil remain mainstays, especially for → Industry, Dispatchable power
Sectoral demand growth
- Fastest growth → Industry, Transport
- Industry alone accounts for >50% of demand increase by 2050
Emissions trajectory
- CO₂ emissions:
- Peak around 2040
- ~3.4 Gt per year by 2050 (STEPS)
India Achieves 50% Non-Fossil Power Capacity Ahead of Time
- Target announced in 2022:
→ 50% non-fossil power capacity by 2030 - Achieved in 2025 for grid-connected capacity
- Achieved in 2026 even after including auto-producers
Investment shift (very important)
- 2015: Fossil : Non-fossil = 1 : 1
- 2025: Fossil : Non-fossil = 1 : 4
- Solar PV investment (last decade):
- USD 113 billion
- More than all fossil fuel power generation combined
📌 UPSC Insight:
India’s transition is investment-driven, not merely target-driven.
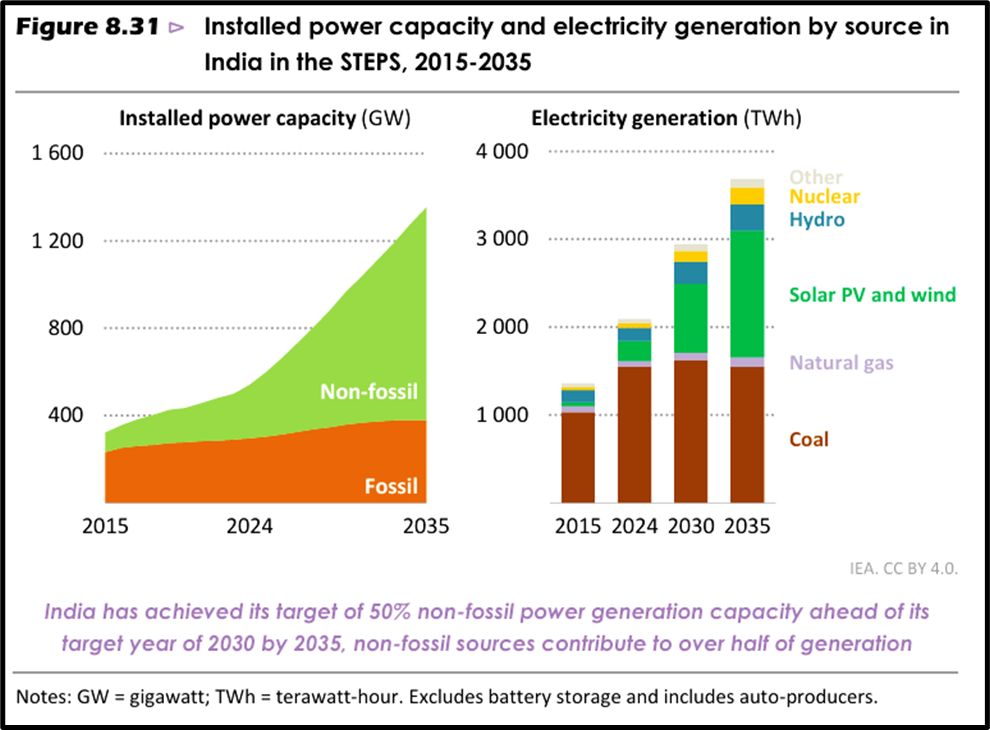
Future Power Mix (STEPS)
Installed capacity
- Non-fossil share:
- 60% by 2030
- 70% by 2035
- >95% of capacity additions to 2035 are non-fossil
Electricity generation
- Solar + wind:
- 11% today → >25% by 2030 → ~40% by 2035
- Nuclear:
- Generation triples by 2035
- Non-fossil sources:
- >50% of electricity generation by 2035
Carbon intensity
- Falls by ~45%
- To ~400 g CO₂/kWh
- Narrows gap with global average
Co-benefits
- Sharp reduction in:
- Fine particulate matter (PM)
- Sulphur dioxide (SO₂)
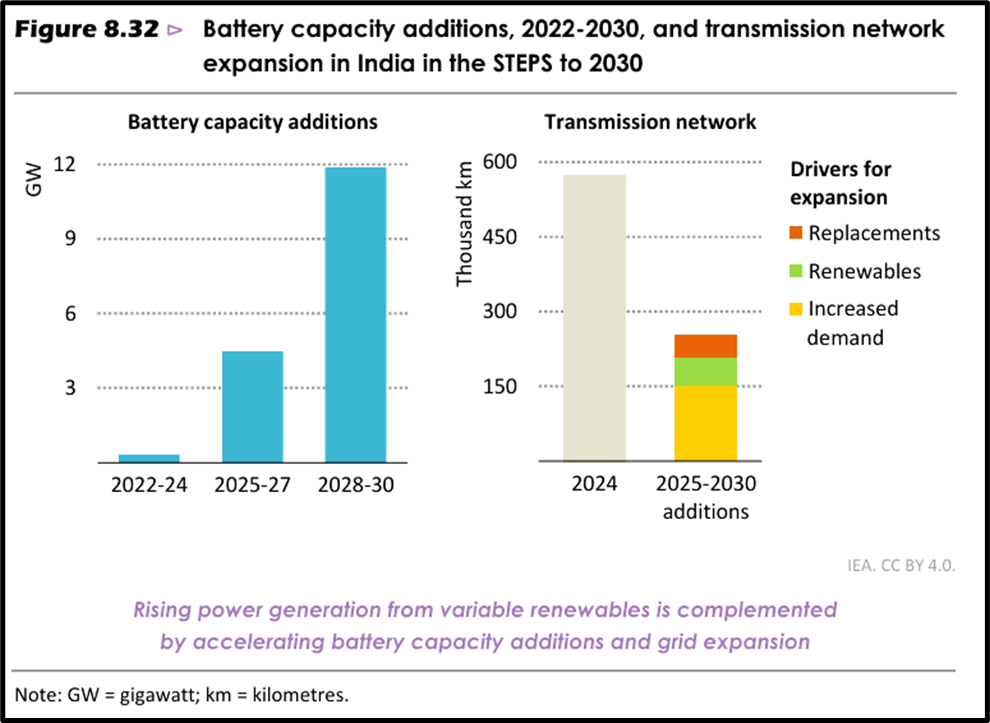
Grid, Storage & System Flexibility Challenges
Storage
- >230 GWh of battery storage added by 2030 (STEPS)
- Government issuing tenders for new storage capacity
Transmission
- Network expands by 35% by 2030
- >200,000 km of new transmission lines
- ~60,000 km specifically for renewable integration
- Green Energy Corridor → Backbone for renewable evacuation
📌 Conceptual takeaway:
Renewable transition = Generation + Storage + Grids, not generation alone.
Financial Stress in Power Distribution
- Distribution companies (DISCOMs) face:
- Delayed payments of ~USD 7 billion (Oct 2025)
- Reforms undertaken:
- Payment security mechanism
- Payment security fund
- State government guarantees
Impact
- Foreign Direct Investment (FDI) in power sector:
- Doubled to ~10% of total power investment
- Compared to average during 2015–2020
UPSC Insights
- India is the single most important driver of future global energy demand
- Energy transition in India is shaped by development needs, not luxury consumption
- Achieving 50% non-fossil capacity early is a landmark but:
- Coal remains important for reliability
- Grid expansion, storage, and DISCOM reforms are critical bottlenecks
- India’s pathway shows how growth, energy security, and climate action can be pursued together
For chapter-wise Environment preparation for UPSC Prelims and Mains, refer to the complete Environment UPSC notes page.