
Carbon Footprint
The carbon footprint is a measure of the total carbon dioxide (CO₂) emissions caused directly or indirectly by an activity.
Key features of Carbon Footprint
- It measures CO₂ released mainly due to burning of fossil fuels
- Expressed as tons of CO₂ per year
- Can be calculated for:
- An individual
- An organisation
- A product
- An entire economy
👉 In simple terms, it answers one question:
“How much CO₂ am I responsible for emitting?”
India’s Commitment on Carbon Footprint
India has pledged to reduce the emissions intensity of its economy by 45% by 2030, compared to 2005 levels
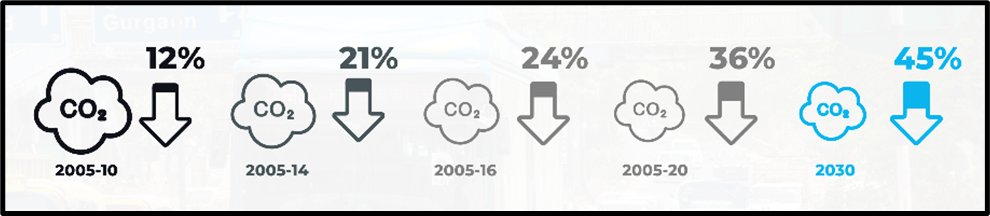
Also, India has pledged for long term Goal to reach Net Zero Emissions by 2070.
⚠️ Important clarification for UPSC:
- India is not committing to absolute emission reduction
- It is committing to reducing emissions per unit of GDP
This reflects India’s developmental priorities and the principle of Common but Differentiated Responsibilities (CBDR).
Historical Trends of CO₂ Emissions
- 1850: UK was the largest CO₂ emitter; nearly 6× US emissions. France, Germany, Belgium followed.
- 1887: US overtook UK as top emitter; rapid growth continued for ~9 decades.
- Mid‑20th century: Industrialization + population growth in US & Europe drove constant emission rise.
- Russia: Major growth 1950s–1980s; sharp decline after Soviet Union’s dissolution.
- China: Surpassed US in 2005; now world’s largest emitter.
📊 Current Status (2022 Data)
- Global emissions: 182× higher than 1850.
- Top emitters: China, US, India, Russia, Japan.
- Per capita emissions: US highest (double China, 8× India).
- Regional share:
- East Asia & Pacific → 44% of global CO₂
- Europe & Central Asia → 17%
- North America → 15%
📉 Key Events Impacting Emissions
- Great Depression (1930s) & WWII end (1945): Temporary drops.
- COVID‑19 (2020): Largest recorded annual drop (–1.5 GtCO₂, ≈ Japan’s yearly emissions). Rebounded by 2021.
📈 Cumulative Responsibility
- Largest cumulative emitters: US & EU (since 1850).
- Europe & Central Asia: Still highest cumulative total, but East Asia & Pacific catching up.
🔑 Conceptual Takeaways
- Global per capita emissions: Stabilized since 2011 → shift toward renewables, EVs, clean tech.
- Top 10 emitters: Account for 76% of global CO₂.
- Climate imperative: Net zero by 2050 to avoid worst impacts.
- Equity issue: Developed regions bear historical responsibility; developing regions rising in share.
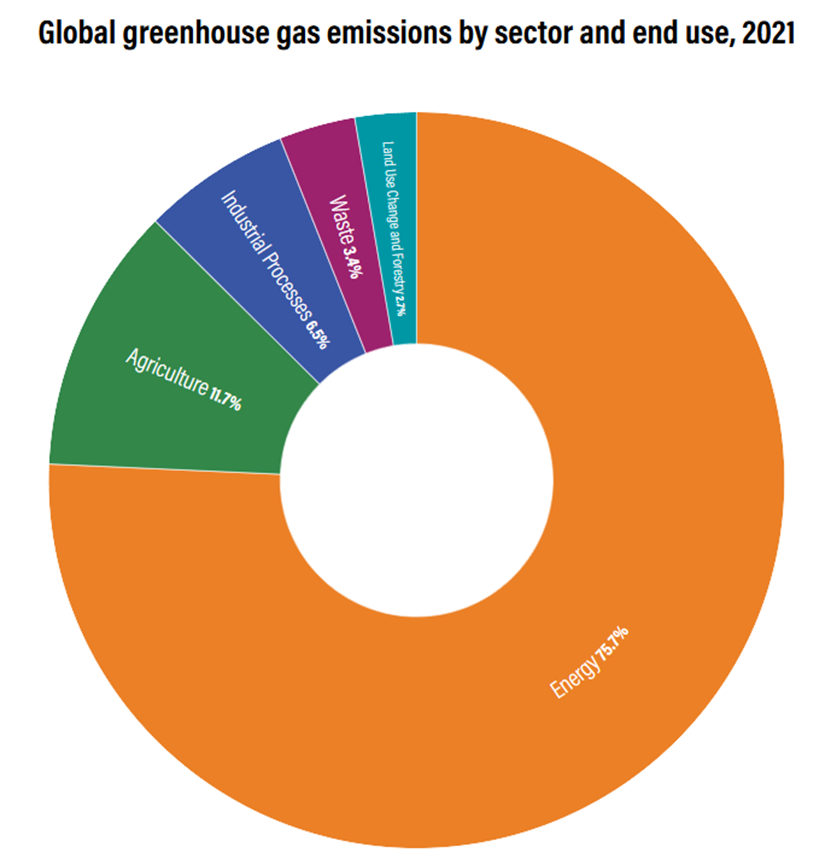
Carbon Footprint Across Major Global Sectors
The World Resources Institute (WRI) has broken down global greenhouse gas emissions into five major sectors.
Sector-wise Contribution to Global Emissions
1️⃣ Energy Sector (Largest Contributor): 75.7%
- Electricity & heat production – 29.7%
- Manufacturing and Construction – 12.7%
- Transportation – 13.7%
- Buildings – 6.6%
- Fugitive emissions
👉 Together, energy-related activities dominate global emissions.
2️⃣ Agriculture – 11.7%
- Methane from livestock
- Nitrous oxide from fertilisers
- Biomass burning
3️⃣ Industrial Processes – 6.5%
- Cement production
- Chemical manufacturing
- Non-energy industrial reactions
4️⃣ Waste – 3.4%
- Methane from landfills
- Wastewater treatment
5️⃣ Land Use Change – 2.7%
- Deforestation
- Forest degradation
- Conversion of natural ecosystems
👉 Key insight:
Climate change is not just an energy problem—it is equally about agriculture, land use, and consumption patterns.
Carbon Bombs: Projects That Threaten Climate Targets
A very contemporary and exam-relevant term is Carbon Bomb.
What is a Carbon Bomb?
A Carbon Bomb is defined as:
“A coal, oil, or fossil gas project that can emit more than 1 gigaton of CO₂ over its lifetime.”
Global Carbon Bomb Reality
- A network called Leave It In the Ground Initiative (LINGO) has identified 425 carbon bombs worldwide
- If all are exploited:
- Their emissions would exceed the 1.5°C carbon budget by two times
Countries with Highest Carbon Bombs
- China
- United States
- Russia
- Saudi Arabia
Carbon Bombs in India (Examples)
- Carmichael Coal Project (Australia, owned by Adani Group)
- Gevra Coal Mines, Chhattisgarh (Coal India)
- Rajmahal Coal Mines, Jharkhand (Eastern Coalfields)
👉 These projects highlight the conflict between energy security and climate commitments.
Leave It In the Ground Initiative (LINGO)
About LINGO
- A think tank and advocacy network
- Mission:
“Leave fossil fuels in the ground and learn to live without them.” - Envisions:
- 100% renewable energy
- Circular economy
- Works through:
- Public mobilisation
- Protests
- Legal challenges against fossil fuel projects
LINGO’s framing has influenced global climate discourse, especially debates around stranded assets.
State-wise Carbon Emissions in India
Understanding spatial distribution is important for India-specific mains answers.
Major Emitting States
Maharashtra | Gujarat | West Bengal | Tamil Nadu
These states dominate due to industry, power generation, and transport density.
Sector-wise Emissions within India
Electricity Generation
- Contributes over 35% of total CO₂ emissions
- Coal-based thermal power is the main driver
Road Transport
- Highest emissions from:
- Maharashtra
- Followed by Gujarat and Uttar Pradesh
Cement and Steel Industries
- Cement production hubs:
- Rajasthan
- Andhra Pradesh
- Tamil Nadu
- Madhya Pradesh
- These states together account for 57% of India’s cement production
- Steel industries concentrated in:
- Chhattisgarh
- Jharkhand
- Maharashtra
- Gujarat
Agriculture-related Emissions
- Methane from biomass and farming activities is highest in:
- Uttar Pradesh
- Punjab
- West Bengal
- Madhya Pradesh
- Andhra Pradesh
👉 This again shows why climate policy cannot ignore agriculture in India.
Carbon Budget
Climate science today is no longer about whether climate change is happening, but about how much warming we can still afford.
The 1.5°C Threshold
- Scientists agree that global average temperature rise should not exceed 1.5°C if we want to avoid catastrophic and irreversible climate impacts.
- To operationalise this, the IPCC introduced the concept of a carbon budget (also called the emissions budget).
What is the Carbon Budget?
The carbon budget is the maximum amount of carbon dioxide humanity can emit while still having a reasonable chance of staying below a chosen temperature limit.
- IPCC estimate (pre-industrial to end of 21st century): ~2,900 gigatonnes (Gt) of CO₂
- Emissions already released by 2017: ~2,200 Gt
👉 This means most of the budget is already exhausted, leaving very little room for future emissions.
Key insight for UPSC:
Climate change is now a problem of allocation of remaining carbon space, not just emission reduction.