
Functional Classification Models of Cities
After understanding what functional classification is, the natural question is:
How exactly do we classify cities based on their functions?
For this, urban geographers have given us various models and techniques—some focusing on one dominant function, others taking a multi-functional perspective.
Let’s explore two major models:
Dominant Functional Approach – Given by C.D. Harris
Let’s begin with the older and simpler model.
🔹 Who proposed it?
- C.D. Harris, a renowned urban geographer.
🔹 What does it suggest?
- Every city has one dominant function—that is, one activity where a majority of the working population is involved.
- Harris believed that this dominant function can be quantified.
He classified towns by analyzing:
- Occupational Significance:
→ The function in which the largest number of people are employed. - Functional Importance:
→ Even if fewer people are employed, some functions are so vital that they define the town’s identity (e.g., a military town or religious centre).
🗂️ Harris’ Classification Categories:
He gave specific thresholds to categorize towns. For example:
| Type of Town | Classification Basis |
|---|---|
| Manufacturing Town | >70% of employed population in manufacturing |
| Retail Centre | Majority in retail trade |
| Diversified City | At least 11% in transportation |
⚠️ Limitations of the Harris Model:
While this model is straightforward, it has serious limitations:
- Most cities in the real world are multifunctional, not mono-functional.
- Using arbitrary cut-off points (like 70% or 11%) doesn’t reflect ground realities.
- It ignores the contribution of other functions that might be important but employ fewer people.
Hence, this model has limited utility in contemporary urban geography.
Multifunctional Approach – Given by Nelson
Let’s now look at a more sophisticated and realistic model.
🔹 Who proposed it?
- Nelson, using data from the U.S. Census.
🔹 What does it aim to do?
- Unlike Harris, Nelson believed that cities cannot be judged by just one dominant activity.
- So, he proposed a statistical method to understand the multifunctional nature of cities.
🔎 Methodology:
Here’s how Nelson went about it:
- Identified 9 types of urban activities (based on the US census categories).
- For each activity:
- He calculated the average percentage of people employed.
- Then, computed the standard deviation from that average.
- Based on this, he determined how much a city’s employment pattern deviates from the national average.
🗂️ Nelson’s Classification:
| Type of City | Criteria |
|---|---|
| Diversified Town | All 9 activities fall within the range of mean ± standard deviation → No dominant activity |
| Unifunctional Town | One activity lies above the positive standard deviation → Indicates dominance |
| Bifunctional Town | Two activities lie above the positive standard deviation |
| Highly Specialized Town | One activity is significantly above standard deviation; others very low |
✅ Strengths of Nelson’s Model:
- Based on empirical and statistical data, not arbitrary thresholds.
- Recognizes the multi-functional nature of urban areas.
- Offers a realistic picture of urban function diversity.
Ashok Mitra’s Functional Classification of Indian Cities
🧑🏫 Who was Ashok Mitra?
- Ashok Mitra was a former Registrar General of the Census of India, and a pioneer in bringing Indian census data into academic geography.
- He attempted one of the most comprehensive functional classifications of Indian cities based on empirical data(from 1961 census)
🧮 His Methodology: Grouping Workers into Broad Functions
Ashok Mitra used Census industrial categories and grouped them into three broad functional categories:
| Function Type | Census Industrial Categories | Description |
|---|---|---|
| A. Manufacturing | Categories III, IV, V, VI | Includes household industries, other industries, construction, and mining |
| B. Trade and Transport | Categories VII, VIII | Trade & commerce, and transport, storage & communication |
| C. Services | Category IX | Includes administration, education, health, finance, etc. |
🧠 You might be wondering — what about Categories I and II? Well, those aren’t included here because they pertain to agricultural activities, and since this classification is focused on urban functions, such categories are deliberately excluded.
🏙️ Classification of Towns Based on Dominance
Using the above groupings, towns were classified into three types:
- Manufacturing Town
→ If the total percentage of workers in Categories III–VI is greater than those in Categories VII+VIII or IX. - Trade and Transport Town
→ If percentage of workers in Categories VII+VIII is greater than either of the other two. - Service Town
→ If Category IX has the largest percentage of workers.
📐 Degree of Specialization: The Triangular Graph Method
Now comes the most unique part of Mitra’s classification — the triangular graph.
- He plotted each town as a point within an equilateral triangle, where each side represented 100% of one function type.
- Then he drew three concentric circles from the triangle’s centroid (where each function is 33.3%).
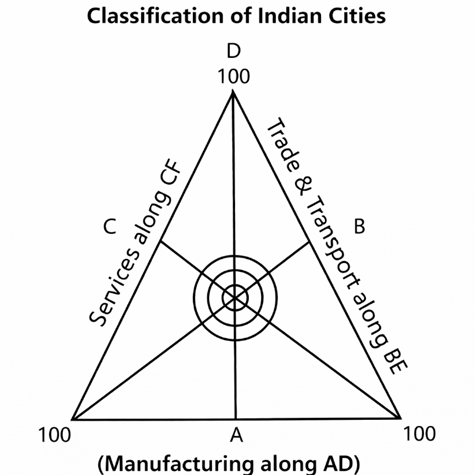
These circles represented increasing degrees of specialization:
| Region in Triangle | Interpretation |
| Within 1st circle | Highly diversified town |
| Between 1st & 2nd circle | Moderately diversified |
| Between 2nd & 3rd circle | Specialized town |
| Outside the 3rd circle | Highly specialized town |
This technique visually captures the balance or dominance among the three functions.
🧾 Findings of Ashok Mitra’s Study
Out of 2,528 towns:
- 736 were agricultural towns (i.e., workers in agriculture > any of the three groups)
- Out of 1,792 non-agricultural towns:
- 655 = Manufacturing towns
- 708 = Trade & Transport towns
- 429 = Service towns
🏙️ Real-world Examples:
- Manufacturing Cities (high specialization):
Ahmedabad, Surat, Jamshedpur, Ludhiana, Salem, Solapur - Trade Cities:
Moderately specialized and widely scattered across India - Service Towns:
Chandigarh, Gandhinagar, Bhubaneswar — mostly planned cities with an administrative character
✅ Key Contributions of Mitra’s Model
- First nationwide classification of Indian cities based on hard data.
- Introduced a visual method to capture functional diversity.
- Highlighted that the most common type of Indian city is the diversified city — one with no single dominant function, but multiple activities.
M.K. Jain’s Functional Classification (1991 Census-based)
🧑🏫 Who was M.K. Jain?
- An Indian geographer who, unlike others, emphasized that no single formula can classify towns universally.
- Proposed a flexible but quantitative approach, using the 1991 Census data.
🔍 Classification Criteria
M.K. Jain gave simple percentage-based thresholds to identify the functional nature of towns:
| Town Type | Criterion |
|---|---|
| Monofunctional Town | If one activity employs ≥ 40% of the working population |
| Bifunctional Town | If no single activity ≥ 40%, but two sectors together ≥ 60% |
| Multifunctional Town | If more than two activities together ≥ 60% |
🧠 Jain’s Key Insight:
- Cities cannot be classified based on a single rule or model.
- Different towns will have different mixes of economic functions depending on region, history, resource base, and planning.
So, instead of imposing rigid categories, Jain’s method gives a data-driven yet flexible framework to understand city functions.
Final Comparison of All Four Models
| Model | Approach | Strength | Limitation |
|---|---|---|---|
| C.D. Harris | Dominant Function (Threshold-based) | Simple and direct | Ignores multifunctionality |
| Nelson | Statistical (Mean & SD) | Accurate & quantitative | Needs detailed occupational data |
| Ashok Mitra | Census-based + Triangular Graph | Visual + Indian context | More complex to compute |
| M.K. Jain | Percentage thresholds (flexible) | Adaptable, Indian census-based | Lacks graphical/spatial analysis |