
Key Concepts related to Inflation
1. Deflation
Deflation refers to a sustained decrease in the overall price level of goods and services in an economy.
In simple words:
Prices are not just rising slowly — they are actually falling.
📌 Illustration:
If the price of rice falls from ₹50 per kg to ₹40 per kg, and this fall persists across the economy, it indicates deflation.
Causes of Deflation
Deflation generally occurs due to:
- Fall in aggregate demand
- Consumers postpone spending expecting prices to fall further
- Businesses lower prices to attract buyers
- Excess supply of goods and services
- Overproduction or inventory buildup
- Firms cut prices to clear unsold stock
Deflationary Spiral (Core Risk)
Deflation can create a self-reinforcing cycle, called a deflationary spiral:
- Falling prices → delayed consumption
- Lower demand → reduced production
- Job losses → further fall in demand
- Prices fall again
This spiral can severely damage economic growth.
Effects of Deflation
- Positive (short term):
- Consumers can buy more with the same income
- Negative (dominant in reality):
- Lower investment
- Rising unemployment
- Declining profits
- Economic stagnation
📌 UPSC Insight:
Economists generally consider deflation more dangerous than moderate inflation.
2. Disinflation
Disinflation refers to a reduction in the rate of inflation, not a fall in prices.
In other words, → Prices are still rising, but at a slower pace.
📌 Example:
- Inflation last year = 6%
- Inflation this year = 3%
This is disinflation, not deflation.
Key Distinction
| Concept | What happens to prices? |
|---|---|
| Inflation | Prices rise |
| Disinflation | Prices rise more slowly |
| Deflation | Prices fall |
Economic Interpretation
Disinflation is generally viewed as desirable, especially when:
- Inflation was previously high
- Price stability is being restored without harming growth
📌 Policy Context:
Disinflation is often the explicit objective of central banks, including RBI under inflation targeting.
3. Stagflation
Stagflation refers to a situation where → High inflation, High unemployment, Low or stagnant economic growth→ exist simultaneously.
This is considered a rare and complex macroeconomic condition because inflation and unemployment are usually expected to move in opposite directions.
Causes of Stagflation
- Supply-side shocks
- Sharp rise in oil or energy prices
- Natural disasters or geopolitical disruptions
- Policy failures
- Excessive money creation without real growth
- Poor coordination between fiscal and monetary policy
📌 Illustration:
A sudden spike in oil prices increases production costs → prices rise (inflation)
Firms cut output and jobs → unemployment rises
Why Stagflation Is Difficult to Handle
- Tight monetary policy to reduce inflation → worsens unemployment
- Expansionary policy to reduce unemployment → fuels inflation
📌 UPSC Insight:
Stagflation presents a policy dilemma where conventional tools become ineffective or counterproductive.
4. Reflation
Reflation refers to deliberate policy measures taken by the government or central bank to revive an economy experiencing deflation or severe slowdown.
In simple terms:
Reflation is controlled inflation induced intentionally to restart economic activity.
Why Reflation Is Needed
During deflation → People hoard money, Consumption collapses, Investment dries up, Output and employment fall
Reflation aims to break this vicious cycle.
Tools of Reflation
- Fiscal policy
- Higher government spending
- Tax cuts
- Public works programmes
- Monetary policy
- Lower interest rates
- Increased money supply
- Quantitative Easing (QE)
Historical Example
During the Great Depression of the 1930s, US President Franklin D. Roosevelt adopted reflationary policies under the New Deal:
- Large-scale public spending
- Job creation programmes
- Social security measures
These policies helped revive demand and restore economic confidence.
Quantitative Easing as Reflation
Under Quantitative Easing (QE):
→ Central banks buy government bonds and assets
→ Liquidity increases
→ Interest rates fall
→ Lending and investment rise
QE has been widely used after global financial crises to support reflation.
5. Open Inflation
Open inflation refers to inflation caused by external or exogenous factors that are largely beyond the direct control of a country’s government or central bank.
In simple terms:
Prices rise not because of domestic policy failures, but due to forces coming from outside the economy.
Examples of Open Inflation
- Global commodity price shocks
- Rise in international crude oil prices
- Oil being a universal input → transport, manufacturing, electricity costs rise
- Firms pass on higher costs → inflation
- Natural disasters
- Earthquakes, floods, hurricanes
- Disruption of supply chains → shortages → higher prices
Open vs Closed Inflation
- Open inflation → externally driven, difficult to control
- Closed inflation → internally driven (excess money supply, demand surge), controllable through monetary policy
📌 UPSC Insight:
Open inflation highlights the limits of domestic monetary policy in a globally integrated economy.
6. Headline Inflation
Headline inflation is the overall inflation rate reported in newspapers and official data releases.
- It is usually measured using Consumer Price Index (CPI)
- Includes all items, especially food and fuel
📌 Example:
If headline inflation is reported as 2%, it means the average price level has risen by 2% over the year.
Limitation of Headline Inflation
- It may not reflect inflation faced by → Specific income groups, Regions, Occupational categories
- Volatile items can distort short-term trends
Hence, policymakers often look beyond headline inflation.
7. Core Inflation
Core inflation measures inflation after excluding volatile items, mainly → Food, Fuel
The objective is to capture underlying, persistent inflationary trends.
Why Exclude Food and Fuel?
- Food prices → affected by weather, monsoon, supply shocks
- Fuel prices → influenced by geopolitics, global markets
📌 Example:
A sudden 50% rise in petrol prices may spike headline inflation, but may not indicate long-term inflationary pressure.
Policy Relevance
- Core inflation is crucial for monetary policy decisions
- Rising core inflation signals structural inflation, often requiring tightening
📌 UPSC Gold Line:
Headline inflation shows the pain today; core inflation shows the disease underneath.
8. Bottleneck Inflation
Bottleneck inflation arises due to shortages in specific goods or inputs, creating a supply-chain bottleneck.
- Demand may be stable
- Supply constraint pushes prices up sharply
Examples
- Microchip shortage
- Limited supply of chips
- Higher prices of smartphones, cars, electronics
- Agricultural bottlenecks
- Drought reduces rice output
- Rice prices rise → affects related food products
Key Characteristics
- Usually temporary
- Difficult to control through interest rates
- Subsides once supply normalises
📌 Policy Insight:
Bottleneck inflation requires supply-side solutions, not aggressive monetary tightening.
9. Base Effect
The base effect refers to a statistical distortion in inflation or growth rates caused by an abnormally high or low base period.
Example:
- 2020 price = ₹100
- 2021 price = ₹120 → +20%
- 2022 price = ₹110
From 2021 to 2022 → −8.33%
From 2020 to 2022 → +10%
The unusually high increase in 2021 distorts interpretation.
Why Base Effect Matters
- Can make inflation appear → Artificially high OR Artificially low
📌 UPSC Insight:
Always check whether inflation changes are real or base-driven.
10. Inflationary Gap
An inflationary gap occurs when → Actual output exceeds potential output, leading to excess demand and rising prices.
Concept of Potential Output
- Maximum sustainable output without inflation
- Determined by labour, capital, technology, productivity
Illustration
- Festive demand surge in India
- Consumption rises sharply
- Production capacity unchanged
- Excess demand → price rise → inflationary gap
Consequences → Rising inflation, Loss of export competitiveness, Overheating of the economy
Policy Response → Tight monetary policy, Fiscal restraint, Demand management
11. Deflationary Gap
A deflationary gap arises when → Aggregate demand is insufficient to absorb potential output.
In other words:
- Economy can produce more
- But spending is too low
Example
- Potential output = 1000 units
- Actual demand = 900 units
- Deflationary gap = 100 units
Effects → Falling prices, Reduced production, Layoffs and unemployment, Economic slowdown
Policy Response → Expansionary fiscal policy, Monetary easing, Demand stimulation
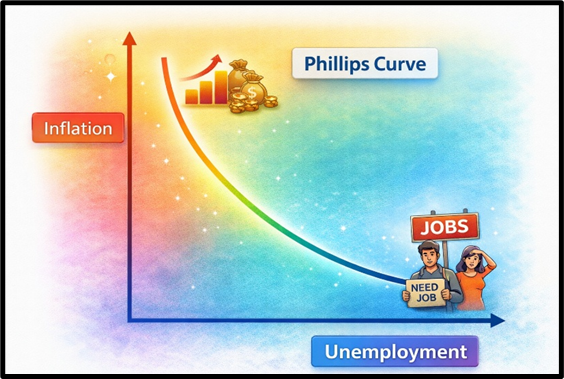
12. Phillips Curve
The Phillips Curve shows an inverse relationship between unemployment and inflation.
It was proposed by A. W. Phillips, based on UK data from the 1950s.
Core Idea
- Low unemployment → higher wages → higher prices → inflation
- High unemployment → weak wage growth → low inflation
Thus, a trade-off appears to exist between inflation and unemployment.
Breakdown of the Phillips Curve
During the 1970s → High inflation, High unemployment
This phenomenon—stagflation—challenged the traditional Phillips Curve.
Modern Understanding
- Phillips Curve may hold only in the short run
- In the long run, inflation depends on → Expectations, Productivity, Supply-side factors
📌 UPSC Insight:
Stagflation exposed the limits of demand-management economics.
Conceptual Summary
| Concept | Core Idea |
| Deflation | Sustained fall in general price level |
| Disinflation | Slowing rate of inflation |
| Stagflation | High inflation + high unemployment |
| Reflation | Policy-driven revival after deflation |
| Open Inflation | Externally driven inflation |
| Headline Inflation | Overall CPI-based inflation |
| Core Inflation | Inflation excluding food & fuel |
| Bottleneck Inflation | Supply-chain shortage inflation |
| Base Effect | Statistical distortion |
| Inflationary Gap | Demand > potential output |
| Deflationary Gap | Demand < potential output |
| Phillips Curve | Inflation–unemployment trade-off |