
Sphere of Urban Influence
Imagine a city as a powerful magnet. Just like a magnet pulls iron pieces toward itself, a city pulls people, services, goods, and activities from its surrounding areas. This “pull” or influence that a city exerts beyond its physical boundaries is what we call the Sphere of Urban Influence, also known as the City Region or Umland (a German term meaning “the land around”).
Key Ideas Explained:
1. Cities don’t exist in isolation
- A city is not an island. It is always linked with the area surrounding it.
- Just like a tree gets support from the soil around it, a city also depends on and supports the region around it.
- This mutual interaction forms what we call a city region—an area influenced by the city’s presence and services.
2. What is a City Region / Umland?
- It is the area around a city where the influence of the city’s functions—like jobs, education, healthcare, shopping, markets, etc.—can be clearly felt and traced.
- People from this surrounding area come to the city regularly for fulfilling various needs—like a student commuting for college, a farmer bringing produce to the market, or a patient visiting a hospital.
So, the distance till which people rely on a city and interact with it is its City Region.
3. What makes the surrounding areas dependent?
- The smaller towns and villages in the vicinity of a city usually don’t have specialized services—no big hospitals, universities, large markets, etc.
- Therefore, they are dependent on the nearby city, which belongs to a higher order in the urban hierarchy.
- Example: A village near Lucknow may not have a heart specialist. So people will go to Lucknow for treatment. That village lies in the city region of Lucknow.
4. Why demarcate a City Region?
- Just like in a school you need to know which class a student belongs to, in urban planning or economic planning, it is essential to know which areas are influenced by which city.
- This helps in planning transportation, resource distribution, setting up schools, markets, and even during disaster management or regional development schemes.
🟩 Methods and Techniques in Demarcating City Regions
When we say a city has an area of influence, the natural next question is: “How do we mark the boundary of this area?”
This is like asking: “How far does the city’s ‘shadow’ or impact reach?”
To answer this, geographers have developed two types of techniques:
- Qualitative Techniques – based on description and interpretation
- Quantitative Techniques – based on numbers, formulas, and calculations
Let’s begin with the first one:
Qualitative Techniques: Understanding Through Human Interpretation
These are descriptive, interpretative methods, which rely more on observation, surveys, interviews, and data interpretation than on mathematical models.
In simple terms, we talk to people, observe places, check records, and draw conclusions based on human experiences.
🔹 Two Types of Data Sources:
- Primary Data Generator
→ Field survey, physical enquiry—going to the place and collecting firsthand data. - Secondary Data Generator
→ Using existing records like government reports, previous surveys, statistical handbooks, etc.
📘 Case Study: Ram Lochan Singh’s Study of Varanasi
Let’s now look at the most famous qualitative study in India, conducted by Ram Lochan Singh on Varanasi, one of India’s oldest urban centers.
This study is a model example of how qualitative techniques are used to define a city region.
🏙️ RL Singh’s Demarcation of Varanasi’s City Region
📅 Historical Background:
- The term “Umland” was first used in India by R.N. Singh in 1955.
- He applied this concept practically by analyzing what Varanasi needs from its surroundings and what it gives back to those areas.
📌 RL Singh Used These Six Functional Indicators:
- Areas from where Varanasi sources vegetables
- Areas from where it gets milk
- Areas from which it receives grain supply
- Areas to which its newspaper editions are distributed
- Areas connected via Varanasi’s local bus network
- The administrative boundary of Varanasi district
➡️ Now notice, first three are inward links (city receives), and the next three are outward links (city provides services).
This was a balanced functional approach.
🎯 A Key Insight:
- RL Singh deliberately avoided Central Place functions, such as religious tourism, even though Varanasi is a major pilgrimage center.
- Why? Because such functions are not regular and consistent in influencing daily regional dynamics.
- Instead, he focused on basic and non-basic functions.
🧭 Let’s Understand Basic vs Non-Basic Functions:
| Function Type | Meaning | Example |
|---|---|---|
| Basic Functions | Revenue-generating for the city | Supplying milk/vegetables/grain |
| Non-Basic Functions | Meant for maintaining city life | Local transport, newspaper distribution |
So, Varanasi doesn’t just receive—it also sends back something to the surrounding region.
📌 Legacy and Critique:
- RL Singh’s method became highly influential in Indian geography.
- Many Indian geographers replicated his model, tweaking it as per their local context.
- However, some issues were noted:
- Over-dependence on secondary data rather than fieldwork.
- Focus was mainly on larger cities with populations in lakhs.
- Several parameters did not reflect Central Place Theory, meaning they weren’t about hierarchy of service centers.
✅ Conclusion:
Qualitative techniques like RL Singh’s study humanize geography.
They bring local realities, functional relationships, and human behavior into the picture.
Such methods are flexible, practical, and intuitive, especially in a country like India where ground realities differ vastly across regions.
Quantitative Techniques: Measuring Urban Influence with Numbers and Models
After World War II, a new wave of thinking swept across Geography, especially in the West.
Geographers wanted to make Geography more scientific, much like Physics or Mathematics.
This gave birth to what is called the Quantitative Revolution in the 1940s and 50s.
They said:
“Let’s not just describe things—let’s measure them!”
And so, mathematical models, equations, graphs, and geometric tools entered Human Geography too.
🎯 Why was this shift important?
- It made inferences more precise, logical, and testable.
- Instead of relying on personal observations (like in qualitative methods), here numbers speak for themselves.
But every coin has two sides.
⚠️ Limitations of Quantitative Techniques:
- These methods can become too rigid.
- They often ignore the emotional, subjective, and human dimensions—like why someone prefers a religious place over a closer shopping center.
- Despite this, these techniques remain widely used because they offer structured and comparable results.
Now, let’s discuss the two major quantitative methods used to demarcate a city’s influence area:
🔷 Proximity Boundary Method
This method is based on geometric logic and simple assumptions.
🧮 How does it work?
- Take a city under study.
- Identify other cities of similar hierarchical status nearby.
- Join these cities with straight lines to the central city.
- Now, draw perpendicular bisectors (just like in school geometry).
- The intersection of these bisectors forms the proximal boundary of the city’s region.
📌 Core Assumption:
If two cities are of the same rank, then the point midway between them is the line where the influence of one ends and the other begins.
It’s a spatial compromise based on equality of urban power.
This also aligns with Christaller’s idea (which we’ll discuss in Central Place Theory), where hexagonal patterns avoid overlapping or unserved areas (known as “shadow zones”).
🔷 Gravity Method (Law of Retail Gravitation)
Let’s understand this method with a story.
🧠 The Thinker: William J. Reilly (1931)
He borrowed an idea from Physics—the Law of Gravity—and asked:
“Just like two planets attract objects based on their size and distance, can cities also attract people the same way?”
He developed what we now call the Law of Retail Gravitation.
🏙️ Core Idea:
- Bigger cities have stronger pull—they attract more people, business, trade, etc.
- People are more likely to travel farther to larger cities, compared to smaller ones.
📌 The “Breaking Point” Formula:
To calculate the boundary of influence between two cities, Reilly gave this formula:
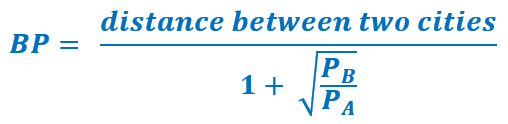
where:
- BP is the breaking point—the location where half the population goes to City A and half to City B.
- PA and PB are the populations of the two cities.
📊 How does it work?
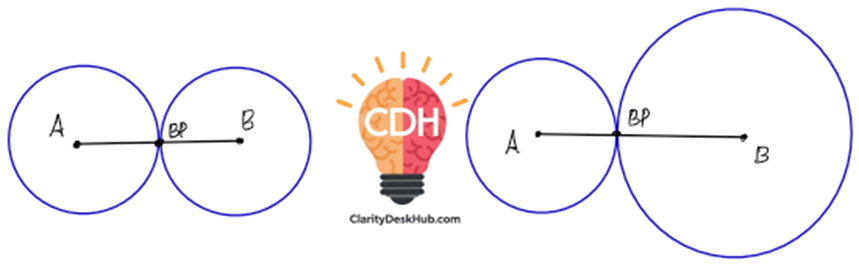
- If both cities have equal population, the breaking point lies midway.
- If one city is larger, the breaking point shifts closer to the smaller city, giving the larger city a wider influence area as shown in the diagram below:
This makes urban hierarchy measurable.
You can repeat this calculation with multiple neighboring cities to create a complete influence map.
⚠️ Limitations of Reilly’s Model:
While it’s mathematically elegant, the model assumes:
- A flat geographical surface
- No rivers, mountains, highways, or political borders
- And most importantly—rational consumer behavior
But we know real life is messier—people choose cities for emotions, traditions, or even political factors, not just distance and population.
🏁 Relevance in Indian Planning
The Planning Commission of India, during the 6th Five-Year Plan, recognized the value of city regions and their influence areas.
They adopted the “Growth Pole Strategy”—a policy that leverages key urban centers to stimulate regional economic development.
✅ Conclusion:
Quantitative techniques offer us a structured, scientific way to understand and map a city’s sphere of influence.
But one must remember: numbers can guide, but they can’t capture the whole story.
Thus, a balanced approach, combining qualitative insights with quantitative rigour, is ideal in Settlement Geography.