
Regional Synthesis
(Understanding the Big Picture of a Region)
Let’s begin by understanding where Regional Synthesis fits in.
Imagine you are assembling a jigsaw puzzle. Each piece on its own might show only a tree, a road, or a building—but when you join all the pieces properly, you see the complete picture of a landscape. This act of joining and making sense of all the pieces is what we call Synthesis.
In Human Geography, a similar process occurs through Regional Synthesis. It is a higher-order approach that arises from the concept of Areal Differentiation.
- Areal Differentiation focuses on describing how one region is different from another.
- Regional Synthesis goes a step further. It asks not just “what is different here?”, but also “how do all these different elements work together to form a unified region?”
Think of it like this:
- Areal Differentiation is like looking at the ingredients separately in a kitchen.
- Regional Synthesis is understanding how those ingredients combine to create a dish.
So, Regional Synthesis is about examining integration and interrelationships—how physical, socio-economic, cultural, and political aspects interact to give a region its unique character. This is not just listing features; it’s about understanding the dynamic interplay among them.
What is a Region?
Now that we’ve introduced the concept, we must understand what a Region actually is.
According to Whittlesey, a region is a distinct portion of the Earth’s surface. But this definition is not static—it’s dynamic, evolving with time. For example:
- The boundaries of the National Capital Region (NCR) in India have expanded over time to include newer towns.
- Similarly, urban and rural boundaries shift as villages urbanize or cities sprawl.
✳️ Key Perspective:
Vidal de la Blache used the French term “pays” to refer to areas that share similar physical and cultural traits. Think of the Amazon and Congo basins—both equatorial, with similar climates and vegetation. These are “regions” because they are distinct from, say, tundra or desert regions.
Types of Regional Attributes
Now let’s list out the key attributes that help define a region. Think of these as the features on a profile card of any region:
| Attribute | Explanation |
|---|---|
| Location | E.g., “Wheat-growing region” or “Industrial region”—based on spatial position. |
| Spatial extent | Every region has a measurable area it covers. |
| Boundaries | These may be clearly marked (like NCR) or fuzzy and transitional. |
| Nature | A region may be formal (uniform characteristics) or functional (centered around a node like a city). |
| Hierarchy | Regions exist in layers—village < district < state < nation. |
| Transitional zones | Not all boundaries are sharp—e.g., the zone between equatorial and savannah regions gradually changes in Africa. |
So, just like in real life, boundaries are often negotiated, shifting, and context-dependent.
Classification of Regions
Let’s now classify regions into two broad types—think of this as organizing your cupboard into two main shelves 😊:
A. Physical Regions
These are shaped by natural features:
- Landform regions (mountains, plains)
- Climatic regions (tropical, temperate)
- Air mass regions
- Ecosystems (deserts, forests)
Example: The Sahara Desert is a physical region defined by aridity, sand dunes, and high diurnal temperature variation.
B. Cultural Regions
These are based on human characteristics:
- Population regions – e.g., densely populated states like Uttar Pradesh
- Linguistic regions – e.g., the Kannada-speaking belt
- Religious regions – e.g., areas predominantly Hindu, Muslim, etc.
These regions may overlap with physical ones or may even cut across them.
Regional Synthesis as a Method of Regionalization
Imagine trying to understand someone’s health. Would you check only their blood pressure and call it a day? Of course not. You’d consider:
- Heart rate
- Sugar levels
- BMI
- Mental health
- Lifestyle factors
Similarly, Regional Synthesis is used to understand the “health” or “status” of a region—by combining multiple variables instead of relying on just one.
Example 1: Identifying a “Backward Region”
You can’t label an area as “backward” just because it has low literacy. Maybe it’s rich in health facilities or has rising incomes. Hence, we need a synthesis of:
- Per capita income
- Literacy
- Mortality rate
- Healthcare access
So, Regional Synthesis offers a multi-dimensional view—holistic and grounded.
Example 2: Defining a Cultural Region
Culture isn’t just language or religion in isolation. It’s a complex blend:
- Language + Ethnicity + Rituals + Customs + Religion
Multidisciplinary Approach – The Strength of Geography
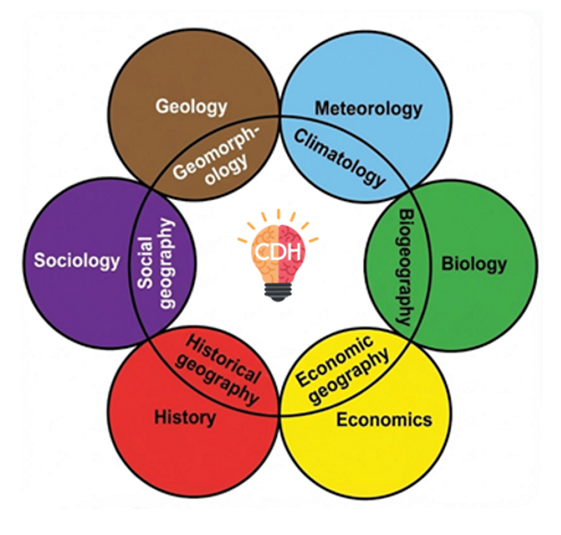
To perform Regional Synthesis effectively, geographers must act like interdisciplinary detectives. They borrow tools from several fields:
Geography’s “Circumference” Includes:
| Discipline | Topics Studied |
|---|---|
| Geology & Geomorphology | Volcanoes, Earthquakes, Rock Types |
| Biogeography | Flora, Fauna |
| Meteorology & Climatology | Rainfall, Temperature, Wind patterns |
| Economics | Trade, Industry, Resource use |
| Sociology & Culture | Religion, Language, Customs |
So, Geography becomes an integrative science, bringing together these strands to build a coherent picture of regions.
Just like a filmmaker uses music, script, lighting, and acting to craft a story—geographers use these disciplines to narrate the story of a region.
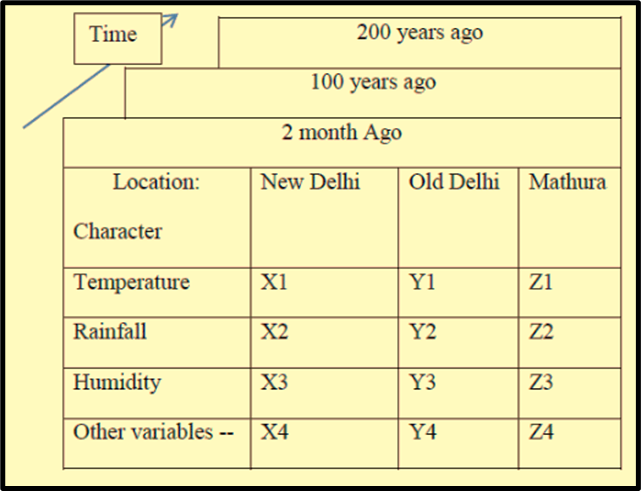
The Geographical Matrix – J.L. Berry’s Model
Now let’s talk about a more technical but powerful visualization tool: the Geographical Matrix, introduced by J.L. Berry, an American geographer.
Think of this matrix as a 3D spreadsheet:
- Rows = Attributes (e.g., rainfall, population, temperature)
- Columns = Locations (e.g., New Delhi, Noida, Mathura)
- Time = The third dimension
Each cell in this matrix holds a geographical fact—just like each pixel in a photograph contributes to the full image.
How can this matrix be used?
Let’s break it down into ten approaches to analyze regions:
| Analysis Type | What it Means |
|---|---|
| 1️⃣ Cells within a row | Shows spatial distribution of one feature (e.g., temperature across cities) |
| 2️⃣ Cells within a column | Shows localized profile (e.g., all features of New Delhi) |
| 3️⃣ Compare two rows | Spatial variation between features (e.g., comparing rainfall and temperature) |
| 4️⃣ Compare two columns | Classic Areal Differentiation (e.g., New Delhi vs. Mathura) |
| 5️⃣ Study sub-matrix | Zoom into part of the region or time (e.g., 5 districts over 20 years) |
| 6️⃣ Same row over time | Temporal-spatial covariation (e.g., Delhi’s temperature in 1925 vs 2025) |
| 7️⃣ Same column over time | Sequence occupancy – how one place changes (e.g., Noida’s land use over decades) |
| 8️⃣ Compare rows across time | How two features change together over time |
| 9️⃣ Compare columns across time | How different locations evolve over time |
| 🔟 Compare sub-matrices over time | Complex pattern analysis (e.g., regional development over decades) |
This matrix is like an MRI scan of a region—letting us view its structure from multiple angles.
The Importance of Regional Synthesis in the Current Era
🌍 A Dynamic Tool for a Dynamic World
In the 21st century, the Earth is not just warming—it’s warming unevenly. While global temperature rise is a universal challenge, its manifestation is regional. For instance:
- Some regions experience severe droughts,
- Others face rising sea levels,
- And some see both—at different times.
Regional Synthesis becomes crucial here—it allows us to disaggregate the global into the regional, helping us understand:
- Where climate is changing,
- How it’s changing,
- And why certain areas are more vulnerable than others.
It’s like using an HD zoom lens: instead of looking at the Earth through a blurry satellite image, we zoom into each region to study its unique climate story.
🔁 Studying Change Over Time: Sequence Occupancy
A key contribution of Regional Synthesis is the ability to study sequence occupancy—i.e., how the use and structure of a region has evolved over time.
For example:
- An area that was once a forest may now be urbanized.
- A desert may have developed into an irrigated agricultural region.
By analyzing variables like land use, population density, and economic indicators over time, regional synthesis helps us understand:
- Regional disparities,
- Shifts in development patterns,
- And long-term environmental transformations.
🧩 Geography as an Integrative Science
This vision was clearly articulated by Fenneman in 1919, and later expanded by Richard Hartshorne, who declared geography to be:
“An integrative and synthetic science.”
Now, let’s pause and understand what “synthetic” means here—not in the artificial sense, but in the original Greek sense:
Synthesis = putting together various parts to make a coherent whole.
According to the Oxford Human Geography Dictionary, synthesis is:
“A complex whole made up of a number of parts unified.”
And James Cunant emphasized that all sciences aim for integration—not just studying parts in isolation but also focusing on how they interact and combine.
🧭 Geography and its Sister Disciplines
Geography doesn’t live in isolation—it shares its terrain with multiple disciplines:
- Anthropology for tribal and cultural studies,
- Meteorology for atmospheric sciences,
- Geology for understanding rock structures,
- Oceanography, Soil Science, Biology…
But here’s what sets Geography apart:
A geologist may study a rock;
A biologist a species of tree;
But a geographer studies how both interact in space and time, within the context of human life.
It’s this connective tissue that makes Regional Synthesis so powerful.
🗺️ Practical Examples of Regional Synthesis
Let’s look at concrete applications:
🔸 Climatic Classification (Köppen)
- Used vegetation and precipitation data to define climate zones.
- This is synthesis: using biotic and abiotic variables together.
🔸 Soil Classification
- Depends on humidity, aridity, and human usage.
🔸 Biogeography
- Biologists may catalog species, but geographers map their spatial distribution and explore human impacts.
These are not just technical exercises. They aid planners, climatologists, and policymakers in making:
- Sustainable land use decisions,
- Resilient urban designs,
- And targeted disaster management plans.
🎯 Conclusion: Why Regional Synthesis Matters More Than Ever
Let us bring this full circle.
In today’s complex world, no phenomenon can be understood in isolation:
- Climate change is not just a scientific issue—it’s economic, social, political.
- Urbanization is not just about infrastructure—it’s about environment, migration, water, and energy.
- Regional disparities are not explained by one metric—but a web of interconnected variables.
Regional Synthesis is the bridge that connects these dots. It provides:
- Holistic understanding,
- Multidisciplinary tools,
- And region-specific insights.
In doing so, it empowers demographers, planners, climatologists, and human geographers to make informed decisions—for the betterment of society and the planet.
📌 In short: Regional Synthesis is not just a technique—it is the soul of modern geography. It gives us the lens to see not only where we are but also why we are the way we are.