
Inequality
India’s Growth–Inequality Paradox
India is often described as one of the fastest growing economies in the world. High GDP growth rates, expanding markets, and rising global stature support this claim.
However, economic growth does not automatically translate into equitable development.
Despite growth:
- Income inequality remains high
- Poverty persists for a large section of the population
This creates a developmental paradox:
👉 Growth without adequate distribution
👉 Rising national income, but uneven well-being
This is why economists stress that how income is distributed is as important as how fast income grows.
What Do We Mean by Inequality?
Inequality refers to the unequal distribution of resources or opportunities among individuals or groups within a society.
Resources and opportunities may include → Income and wealth, Education, Employment, Social status, Political power
Inequality affects → Social cohesion, Economic mobility, Long-term development sustainability
Types of Inequality
Broadly, inequality can be classified into social inequality and economic inequality.
A. Social Inequality
Social inequality refers to unequal access to status, power, and prestige in society.
It may arise due to differences in → Education, Occupation, Gender, Caste, Religion, Race
Indian context example:
The caste system historically produced rigid social hierarchies. Certain communities were → Denied education, excluded from occupations, Restricted from social mobility
Thus, social inequality often becomes structural and intergenerational.
Important insight → Social inequality often feeds into economic inequality, creating a vicious cycle.
B. Economic Inequality
Economic inequality refers to unequal distribution of → Income, Wealth, Assets, Economic opportunities
It includes differences in → Wages and salaries, Property ownership, Access to credit and capital
Indian context example:
A small percentage of the population—such as the top 1%—owns a disproportionately large share of national wealth, while a significant section struggles with basic needs.
Economic inequality directly affects → Consumption levels, Savings and investment capacity, Human development outcomes
Measuring Inequality: Why Indicators Matter
To design effective policies, governments and researchers need quantitative measures of inequality. Some of the indicators are discussed below:
Quintile Ratio
Concept
The Quintile Ratio compares:
- Income or wealth of the top 20% of the population
with - Income or wealth of the bottom 20%
Formula
Quintile Ratio = (Income or wealth of top 20%) / (Income or wealth of bottom 20%)
Interpretation
- Higher value → greater inequality
- Lower value → more equal distribution
Why it is useful
- Simple to calculate
- Easy to understand
- Gives a quick snapshot of extremes
Limitation
- Ignores the middle 60% of the population
- Does not show inequality within groups
Palma Ratio
Concept
The Palma Ratio focuses on inequality between:
- The top 10%
and - The bottom 40%
It was proposed by Gabriel Palma.
Formula
Palma Ratio = (Income share of top 10%) / (Income share of bottom 40%)
Example
If:
- Top 10% earns 30% of total income
- Bottom 40% earns 10% of total income
Then:
Palma Ratio = 30 / 10 = 3
This means the top 10% earns three times the income of the bottom 40%.
Why Palma Ratio is especially relevant for developing countries
- Middle-income groups are often relatively stable
- Inequality is driven mainly by extremes (very rich vs very poor)
- Hence, Palma Ratio captures inequality more sharply than measures like the Gini coefficient in such contexts
Advantages
- Simple and intuitive
- Focuses on the most unequal segments
- Useful for policy targeting
Limitations
- Ignores income distribution within top 10% and bottom 40%
- Does not capture non-income inequalities like → Education, Health, Social mobility
Lorenz Curve
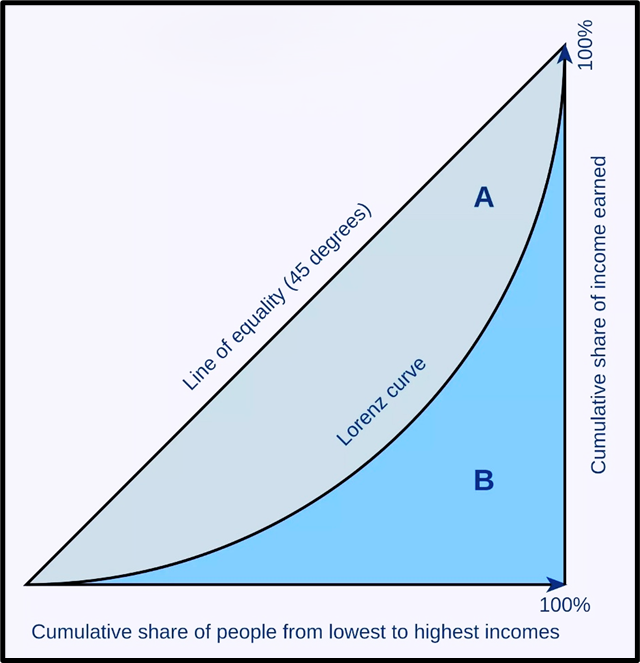
The Lorenz Curve is a graphical representation of income distribution in a population.
Its purpose is simple but powerful:
👉 to show how evenly or unevenly income is distributed across society.
How the Lorenz Curve is drawn
- X-axis: Cumulative percentage of population (from poorest to richest)
- Y-axis: Cumulative percentage of total income
Each point on the curve answers the question:
What share of total income is earned by the bottom x% of the population?
Line of Perfect Equality (45° Line)
If income were perfectly equally distributed, the Lorenz curve would coincide with a 45-degree straight line, known as the line of perfect equality.
This implies:
- Bottom 10% earns 10% of income
- Bottom 50% earns 50% of income
- Bottom 100% earns 100% of income
In other words, every percentile earns an equal share.
👉 This is a theoretical benchmark, not a real-world situation.
Deviation from Equality = Inequality
In reality:
- Income is never perfectly equal
- The Lorenz curve bows below the line of equality
Key insight:
- Greater the deviation from the 45° line
- Greater the level of income inequality
Thus, the Lorenz curve visually captures:
- Concentration of income
- Exclusion of lower-income groups
Gini Coefficient: Measuring Inequality Numerically
While the Lorenz Curve gives a visual picture, policymakers also need a single numerical value.
This is provided by the Gini Coefficient.
Definition
The Gini coefficient is a numerical measure of income inequality that ranges from 0 to 1.
Formula
G = A / A + B
where:
- A = Area between the Lorenz curve and the line of perfect equality
- B = Area under the Lorenz curve
Interpretation of Values
| Gini Value | Meaning |
| 0 | Perfect equality (everyone earns the same income) |
| 1 | Perfect inequality (one person earns all income) |
👉 In practice, countries lie between these extremes.
Why Lorenz Curve and Gini Coefficient Matter
These tools are crucial because they:
- Go beyond averages like per capita income
- Reveal who benefits from growth
- Help identify vulnerable income groups
For example:
- A Lorenz curve skewed heavily towards the bottom indicates
👉 a large population earning very little income
This allows governments to:
- Design targeted redistribution policies
- Improve social welfare outcomes
Reasons for Inequality in India
Income inequality in India is structural, historical, and institutional.
1. Historical Factors
- Colonial legacy distorted economic structures
- Caste system restricted access to → Education, Employment, Social mobility
Result → Persistent intergenerational inequality
2. Unequal Distribution of Resources
There is a sharp divide in access to → Healthcare, Education, Sanitation, Infrastructure
This prevents large sections from → Enhancing productivity, Escaping poverty
3. Labour Market Discrimination
Discrimination based on → Gender, Religion, Caste
Examples:
- Women earning less than men
- Marginalised castes excluded from high-paying jobs
This creates → Wage gaps, Occupational segregation
4. Unequal Distribution of Land
- Land ownership concentrated among a few
- Small and marginal farmers lack productive assets
Impact:
- Low agricultural incomes
- Rural poverty
- Limited economic mobility
How to Combat Inequality
Reducing inequality requires multi-dimensional policy intervention.
1. Promote Education and Skill Development
- Investment in education and training
- Enhances employability and wages
- Breaks the poverty trap
2. Progressive Taxation Policies
- Higher income → higher tax rate
- Tax revenue funds → Healthcare, Education, Infrastructure
This enables redistribution without harming growth.
3. Inclusive Employment Policies
- Incentives to firms hiring from → Women, Marginalised communities, Persons with disabilities
This promotes → Economic inclusion, Equal opportunity
4. Strengthen Social Safety Nets
Programs such as → Food subsidies, Healthcare benefits, Housing assistance
They → Protect the vulnerable, Stabilise consumption, Reduce extreme inequality
This article forms part of the broader Indian Economy syllabus for UPSC preparation.