Horizontal Distribution of Temperature
The average temperature of Earth is approximately 15°C, but it is not uniformly distributed. Various geographical and atmospheric factors influence how temperature varies across different latitudes.
🌡️ Mean Annual Temperature Distribution
🔶 Understanding the Basics — What Are Isotherms?
Let’s begin with the concept of isotherms — a very powerful way to represent how temperature varies horizontally across the Earth’s surface.
👉 Isotherms are imaginary lines drawn on a map that join places having equal temperatures.
This is very much like contour lines in topography that join places of equal height, but here, it’s temperature instead of altitude.
📝 Important Note:
When we draw isotherms, we ignore the effect of altitude. Why? Because to make fair comparisons, we reduce all temperature readings to sea level. This is called reduction to mean sea level — a standard practice in climatology.
Thermal Anomaly (Isanomalous Temperature)
- The difference between the actual temperature of a place and the average temperature of its latitude.
- Example: If a place at 30° latitude has a temperature warmer or colder than the global mean for 30°, it shows a thermal anomaly.
Isanomals
- Lines on maps that connect places with equal thermal anomalies (similar to isotherms but for deviations).
🔶 General Characteristics of Isotherms: How Do They Behave?
Let’s now study how these isotherms behave in different regions.
Generally, Follow the Parallels (Latitudes)
This is simple logic. Every latitude receives almost the same amount of insolation (solar energy). So, the temperature remains somewhat consistent along each latitude.
Hence, isotherms generally follow the path of latitudes.
More Irregular in the Northern Hemisphere
Now here’s something interesting — isotherms become twisted or distorted in the Northern Hemisphere.
Why?
Because the land-sea contrast is much higher in the north. Land heats and cools faster than water, so the temperature pattern becomes irregular.
Thermal Equator Lies North of the Geographical Equator
You’d expect the hottest zone — the Thermal Equator — to coincide with the Geographical Equator, right?
But no, it lies slightly to the north.
Why?
Because most of Earth’s landmass is in the Northern Hemisphere, and land heats more than oceans. So, the zone of maximum temperature shifts northwards.
🔶 Bends in Isotherms — Especially at Ocean-Continent Boundaries
At the boundary between oceans and continents, isotherms bend suddenly. This is due to:
- Differential heating — Land heats faster and to a higher degree than water.
- Ocean currents — Some bring warm water, some bring cold.
So even at the same latitude, you may find different temperatures over land and sea. This distorts the isotherms.
🔶 Spacing Between Isotherms — What Does It Tell Us?
This is a critical analytical point and often asked in UPSC questions.
- When isotherms are close together, it indicates a high thermal gradient — i.e., temperature changes rapidly over a short distance.
(Think of mountainous regions or continental interiors.) - When isotherms are far apart, it indicates a low thermal gradient — i.e., temperature changes slowly across space.
(Think of oceans or equatorial regions.)
🔶 General Global Temperature Distribution — Major Patterns
Let’s now see the bigger picture — how temperatures are distributed across the globe.
🔸 Highest Temperatures: Tropics and Subtropics
These areas receive direct insolation most of the year. Hence, they are the hottest zones.
🔸 Lowest Temperatures: Polar & Subpolar Interiors
Why are these places so cold?
- High latitudes → low sun angle → less insolation
- Continental interiors → absence of sea’s moderating effect → intense cold
(This is called continentality.)
🔸 Continentality and Temperature Range
Land heats and cools faster than water. So:
- Interiors of continents have high diurnal and annual temperature ranges.
- Oceans have low temperature ranges due to:
- High specific heat of water
- Mixing of layers through currents
🔸 Why Northern Hemisphere Is Warmer Overall?
- Northern Hemisphere: 15.2°C
- Southern Hemisphere: 13.3°C
- Reason: More landmass in the Northern Hemisphere, which heats up and cools down faster than the ocean-dominated Southern Hemisphere
🔶 Thermal Gradient Across Latitudes
- Tropics have low temperature gradients — Sun is nearly overhead year-round, so temperature doesn’t change much.
- Mid and High Latitudes show high temperature gradients — Insolation reduces rapidly toward the poles, and the sun’s apparent path varies a lot seasonally.
🔶 Influence of Ocean Currents on Isotherms
Let’s take real-world examples to see how ocean currents influence isotherms. If you have read about the concept of ocean current, you can grasp it more nicely.
🔸 Warm Ocean Currents
These raise temperatures in adjacent areas, causing isotherms to shift polewards.
Example:
- Gulf Stream and North Atlantic Drift warm Europe.
- Kuroshio Current in the Pacific has a similar effect.
So, you’ll see widely spaced isotherms (low gradient) along eastern margins of continents — due to warm currents.
🔸 Cold Ocean Currents
These lower temperatures in nearby areas, causing isotherms to shift equatorward and come closer (high gradient).
Example:
- Peru Current, Canaries Current, California Current
So, along western margins of continents, isotherms are closely spaced.
🔶 Role of Mountains in Temperature Distribution
Mountains also create thermal boundaries.
Example:
- Himalayas block cold Siberian winds, keeping India relatively warm.
- Rockies and Andes block maritime influence from penetrating deep inland in North and South America, respectively.
🌡️ Seasonal Temperature Distribution
While the mean annual temperature gives a static picture, it doesn’t tell the whole story.
To understand how and why temperatures change throughout the year, we study seasonal temperature distribution — particularly during January and July, which represent opposite seasons in the two hemispheres.
Let’s explore how these patterns unfold and what factors cause the deviations.
🔶 General Pattern: Latitude Still Rules, But with Deviations
- Generally, isotherms follow latitude lines, because solar radiation is latitude-dependent.
- However, this ideal pattern is disturbed more prominently in January than in July, especially in the Northern Hemisphere.
👉 Why?
Because the Northern Hemisphere has more landmass, which heats and cools faster than oceans. This leads to greater deviations from the ideal latitudinal pattern in temperature distribution.
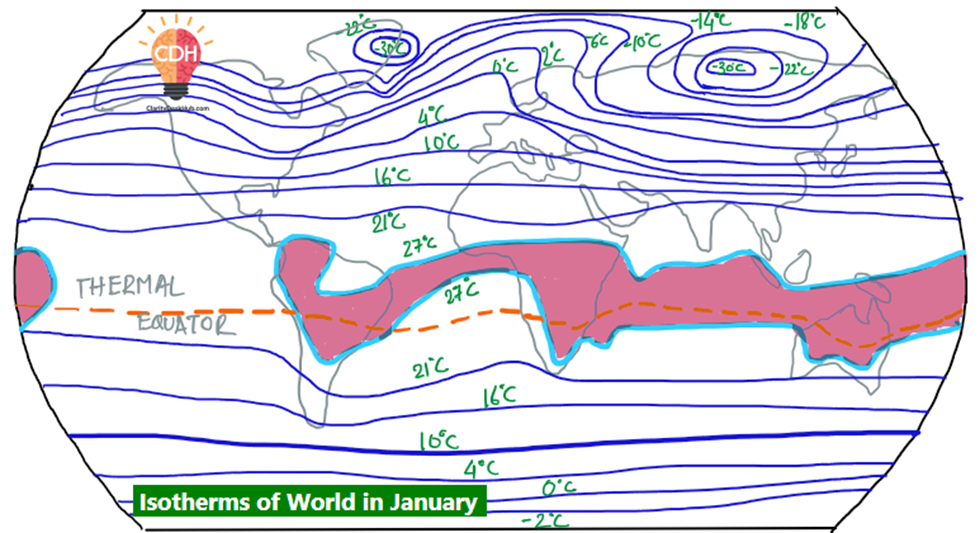
🌍 Seasonal Pattern: January
Let’s first look at January, when it’s winter in the Northern Hemisphere and summer in the Southern Hemisphere.

🔷 Northern Hemisphere: Winter Season
1. Western Margins are Warmer Than Eastern Ones
Why this contrast?
Because of the Westerlies — prevailing winds from west to east — which pick up heat from the oceans and bring it into western coastal areas.
So:
- Western Europe is warmer than it “should” be at that latitude (thanks to the North Atlantic Drift).
- But Eastern Canada or Eastern Russia? Much colder.
2. Eastern Margins: Closely Spaced Isotherms
- Because the ocean’s moderating effect is weaker here, the temperature drops sharply from coast to interior.
- This results in a high temperature gradient, so isotherms are tightly packed.
3. Ocean vs Continent: Bends in Isotherms
- Over oceans: Isotherms bend northward (poleward shift) due to warm currents like:
- Gulf Stream
- North Atlantic Drift
- Over continents: Isotherms bend equatorward due to continentality — i.e., cold air from poles can easily move southward into the interiors.
🧊 Coldest areas:
- Northern Siberia and Greenland — classic examples of extreme continentality.
🔷 Southern Hemisphere: Summer Season
The Southern Hemisphere is mostly oceanic, and this makes a big difference.
1. Oceanic Influence = Smooth Isotherms
- Since water moderates’ temperature, the isotherms are smooth and almost parallel to the latitudes.
- No sharp gradients, no erratic bends.
2. High Temperature Belt Along ~30°S
- Why 30°S? Because of clear skies and subsidence of air in subtropical high-pressure zones.
- Anticyclonic circulation prevents cloud formation → maximum insolation.
3. Thermal Equator Shifts South
- With the sun’s apparent southward movement, the ITCZ shifts south, dragging the thermal equator along with it.
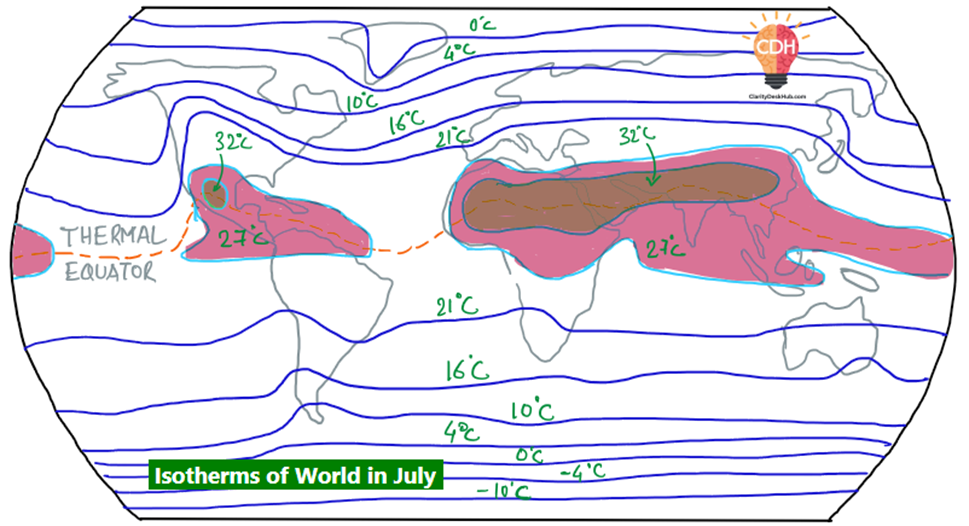
☀️ Seasonal Pattern: July
Now comes July — when it’s summer in the Northern Hemisphere and winter in the Southern Hemisphere.

🔷 Northern Hemisphere: Summer Season
Here, things get a bit chaotic.
1. Zig-Zag Pattern of Isotherms
- Due to uneven land heating, the isotherms don’t stay straight.
- Instead, they show a zig-zag or irregular path — a classic sign of continental heating.
2. Thermal Equator Shifts North
- As the sun moves northward, so does the ITCZ → hence the thermal equator shifts to the north of the geographical equator.
3. Temperature Records
- Equatorial oceans: >27°C
- Subtropical land regions of Asia (30°N): >30°C
(Think of Thar Desert, parts of Iran, Arabian Peninsula)
4. Annual Range Extremes
- Siberian interior: >60°C annual range
(Severe cold in January, extreme heat in July — classic case of continentality.) - Between 20°S and 15°N: Range as low as 3°C (thanks to oceanic influence and solar consistency)
5. Bends in Isotherms: Opposite of January
- Over land: Isotherms bend poleward due to overheated interiors (hot air pushing northward).
- Over oceans: Isotherms bend equatorward because of their cooler temperatures and stabilizing influence.
🧊 Coldest in July: Greenland
🔥 Hottest zone in July:
- North Africa
- West Asia
- North-West India
- South-Eastern USA
🔷 Southern Hemisphere: Winter Season
Even now, oceans dominate, so things are relatively stable.
1. Regular Pattern of Isotherms
- The oceanic influence ensures that temperature changes gradually, not abruptly.
- Hence, isotherms are smooth and parallel to latitudes.
2. Slight Bending Near Continents
- Near continental margins, isotherms bend equatorward, showing the cooling effect of nearby landmasses during winter.
