
Stock Market Index
Suppose someone asks you about the traffic situation in your city right now. Your city may have thousands of roads and intersections, and it would be practically impossible to check each one before giving an answer. Instead, you would quickly observe a few important roads, highways, and major junctions spread across different parts of the city. If these key locations show heavy congestion, you would conclude that the overall traffic situation is chaotic. If traffic is flowing smoothly, you would assume the city traffic is normal. In other words, a few important roads act as a barometer that reflects the condition of the entire city.
The stock market works in a very similar way. In India, there are thousands of listed companies—around 5,000 companies on the Bombay Stock Exchange (BSE) and about 2,000 companies on the National Stock Exchange (NSE). If someone asks how the stock market is performing today, it would be unrealistic to check the price movement of every single company.
Instead, analysts track a selected group of important companies from different sectors such as banking, IT, infrastructure, FMCG, and energy. If most of these representative companies are rising in price, we say the market is bullish; if most are falling, the market is bearish; and if movements are mixed, the market is considered flat or sideways. This carefully selected group of companies collectively forms what we call a Stock Market Index.
A Stock Market Index is essentially a pre-packaged indicator that reflects the overall movement and sentiment of the stock market. Instead of tracking dozens of companies manually, the index continuously monitors a selected basket of important stocks and calculates a single numerical value representing the market’s performance.
In India, the two most important indices are:
- S&P BSE Sensex – Represents the Bombay Stock Exchange (BSE)
- Nifty 50 – Represents the National Stock Exchange (NSE)
Another widely followed index is the Bank Nifty, which specifically represents the banking sector.
The term “S&P” in S&P BSE Sensex refers to Standard & Poor’s, a globally recognized credit rating agency. S&P provides the technical expertise required for index construction, which is why the index carries its name. Meanwhile, the indices of the National Stock Exchange are managed by NSE Indices Limited, a subsidiary of the NSE.
The Nifty 50, for example, consists of 50 of the most actively traded and influential companies on the NSE. An ideal index should accurately represent market sentiment, meaning it reflects what investors collectively expect about the future of the economy. When the index rises, it indicates that investors are optimistic about future economic prospects. Conversely, when the index falls, it signals pessimism about future growth.
Practical Uses of a Stock Market Index
1. Information about Market Sentiment
One of the most important functions of an index is to provide instant information about the overall market trend. In fact, stock market indices are often seen as a mirror of the economy’s expectations. When an index rises steadily, it indicates that investors believe the economy will perform well in the future. When the index declines, it suggests fear or pessimism among market participants.
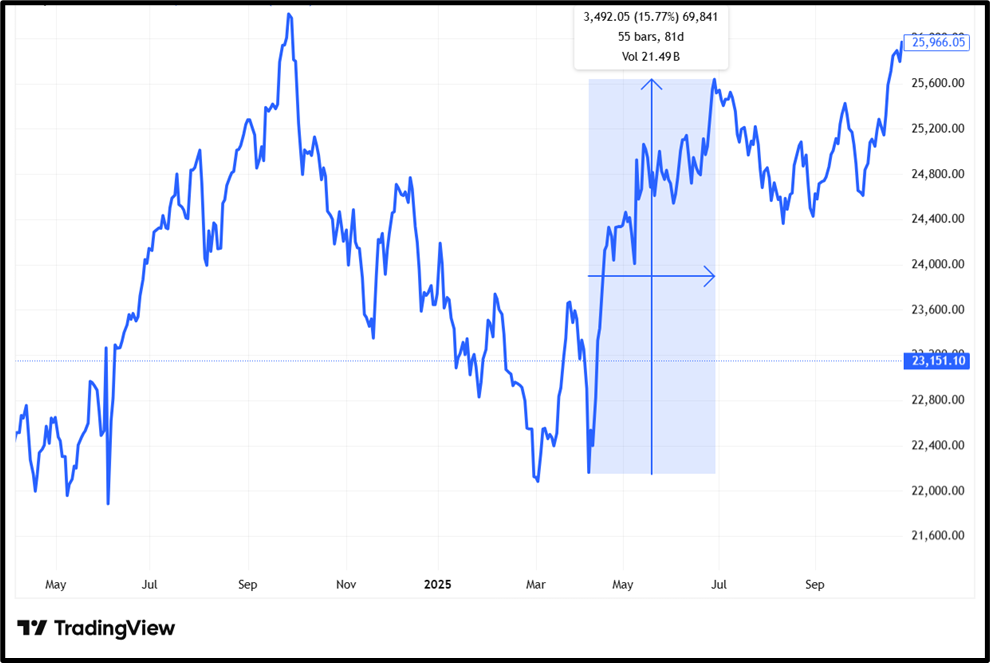
For example, suppose the Nifty 50 stood at 22,146, on 07 April 2025 and later rose to 25,638. This increase of 3,492 points (around 15.77%) indicates strong optimism among investors regarding the future of the Indian economy.
At the same time, indices also capture short-term sentiment. If the index falls by 40 points within an hour during a trading session, it indicates short-term nervousness among traders.
Thus, the index acts as a real-time indicator of economic expectations.
2. Benchmarking Investment Performance
Another important use of an index is benchmarking. Investors need a reference point to evaluate whether their investment strategy is successful.
Imagine you invested ₹1,00,000 in stocks and after one year your investment grew to ₹1,20,000, giving you a 20% return. At first glance, this seems like excellent performance. However, suppose during the same period the Nifty 50 increased by 30%. In that case, despite earning 20%, you actually underperformed the market.
Therefore, most investors aim to beat the index. Without an index, it would be impossible to objectively judge investment performance.
3. Trading on the Index
Indices are also actively used for trading purposes. Many traders prefer trading the index instead of individual stocks because the index represents the broader market trend.
Consider a situation where the Union Budget is about to be presented by the Finance Minister at 10:30 AM. Suppose the Nifty index is at 18,150 just before the announcement. If traders believe the budget will be favorable for economic growth, they may expect the market to rise. Based on this expectation, they might buy the index. If the budget turns out to be positive and the index rises to 18,450, they could exit the trade and earn a 300-point profit.
Such trading is possible through the derivatives market, where traders can buy or sell index-based instruments like futures and options.
4. Portfolio Hedging
Investors often hold a long-term portfolio consisting of 15–20 stocks. While these investments are meant for long-term wealth creation, short-term market downturns can temporarily erode portfolio value.
To protect against such market-wide declines, investors use index-based hedging strategies. For example, if they expect a temporary market crash similar to the 2008 financial crisis, they can take positions in index derivatives that gain value when the market falls. This helps offset losses in the portfolio.
In this way, the index serves as a risk management tool.
How Stock Market Indices Are Constructed
For an index to represent the economy effectively, it must follow a systematic construction methodology.
First, stock exchanges select companies that meet specific criteria such as liquidity, trading frequency, financial strength, and sector representation. If a company fails to meet these requirements over time, it may be replaced by another company that qualifies.
Once the list of companies is finalized, each stock is assigned a weightage. Weightage determines how much influence a particular company has on the index movement. For example, if ITC Limited has a weightage of 3.85% in the Nifty 50, then approximately 3.85% of the index movement can be attributed to ITC’s price movement.
Indian stock indices use the Free-Float Market Capitalization Method to assign these weights. In this method, weightage is determined based on the company’s free-float market capitalization, meaning the market value of shares that are freely available for trading.
The formula is:
Free-Float Market Capitalization = Number of Outstanding Shares × Market Price of the Share
For example, if a company has 100 shares in the market and each share is priced at ₹50, the market capitalization becomes 100 × 50 = ₹5,000. Companies with larger market capitalizations receive higher weightage in the index.
This is why large companies like Reliance Industries, HDFC Bank, ICICI Bank, and Infosys have a significant influence on the movement of the Nifty 50 index. If the share price of Reliance changes significantly, it can noticeably affect the index because it carries a large weight in the index composition.
Sector-Specific Indices
While indices like Sensex and Nifty represent the overall market, there are also sectoral indices that focus on specific industries.
For example:
- Bank Nifty represents the banking sector
- Nifty IT (CNX IT) represents information technology companies
- Other sectoral indices may represent industries such as FMCG, Pharma, Auto, or Infrastructure
These sectoral indices help investors understand how a specific industry is performing within the broader market. For instance, the overall market may be stable, but the IT sector may be booming, which would be reflected in the Nifty IT index.
✅ In essence, a stock market index is not just a number displayed on financial news channels. It is a carefully constructed economic indicator that summarizes the collective expectations of investors, measures investment performance, enables trading opportunities, and helps manage financial risk.
This article forms part of the broader Indian Economy syllabus for UPSC preparation.