Agricultural Regionalisation
🔶 What is a “Region”?
Let’s begin with the basic idea — “Region”.
Geographers often use this term to understand differences across the Earth’s surface. But what is a region?
👉 A region is simply an area that stands out from others based on certain criteria.
For example:
- If we look at temperature, then “tropical region” and “temperate region” are two different regions.
- If we take agriculture, then the tea-growing region of Assam is quite different from the wheat-growing plains of Punjab.
As defined by geographer Whittlesey (1929) — a region is a “differentiated segment of the Earth’s surface”.
So, regionalisation is just the act of dividing the Earth into meaningful chunks — based on something. When we apply this idea to agriculture, it becomes agricultural regionalisation.
🔶 What is Agricultural Regionalisation?
Now, let’s apply this concept to agriculture.
🌱 Agricultural Regionalisation is the process of dividing land into zones or regions based on similar agricultural characteristics — such as:
- Dominant crops
- Type of farming
- Soil quality
- Climate
- Farming practices
But here’s the key thing:
Agricultural regionalisation is not just a method of drawing lines on a map, it’s a tool to understand how and why agriculture varies across different areas.
🧭 So, it helps us read the landscape like a book — where each page tells a different story of soil, seeds, seasons, and societies.
🔶 Why Do We Need Agricultural Regionalisation?
Let me ask you a simple question:
🧠 Would you grow apples in Rajasthan or bananas in Himachal Pradesh?
Of course not. Because agriculture depends on local conditions.
That’s why policy-makers, farmers, scientists, and geographers need agricultural regions — to:
- Plan agriculture according to resources
- Design irrigation systems
- Improve crop productivity
- Support food security
It’s like dividing a class of students into groups based on their strengths — so each group gets the right attention and tools to succeed.
🗺️ Techniques of Delimiting (Drawing) Agricultural Regions
But now comes the real challenge.
How do we draw boundaries of agricultural regions?
See, in real life, nature doesn’t draw sharp lines. A wheat field might slowly merge into a sugarcane patch, or a dry zone might gradually turn into a well-irrigated one.
So, geographers have developed 4 major techniques to demarcate agricultural regions — each with its pros and cons.
1️⃣ Empirical Technique – The “Observation-Based” Method
📌 This is the oldest and most intuitive method.
🔍 Geographers simply observe the ground realities, look at the dominant crops, and use experience of farmers to identify agricultural belts.
👉 Example:
In the USA, based on dominant crops:
- Cotton Belt
- Corn Belt
- Wheat Belt
🧩 Problem?
- It’s too generalized
- Based on observation, not statistics
- Can vary from person to person
Think of it like a chef tasting food and deciding the recipe. Useful, but not always scientific.
2️⃣ Single Element Technique – One Crop = One Region
📌 This method selects one dominant crop to define a region.
🗺️ For example:
- If wheat is the most grown crop, the region becomes “wheat region”
- If rice dominates, it becomes “rice region”
✅ It’s simple and easy to understand
❌ But it ignores all other crops
For example: Western UP is called a sugarcane belt. But it also grows wheat and rice. So, this technique can oversimplify reality.
It’s like saying — “This city is only Hindi-speaking” — ignoring that many people there may speak Punjabi or English too.
3️⃣ Multi-Element (Statistical) Technique – A Better, Data-Driven Approach
📌 Here, instead of just one crop, we consider a combination of crops and livestock.
📊 Example: Weaver’s Crop Combination Regions
He used statistical formulas to identify areas where groups of crops were grown together regularly.
✅ It’s less biased
✅ Shows true complexity of agriculture
❌ Needs good data — which may not always be available
Think of it like a doctor using blood reports, x-rays, and symptoms together — to diagnose more accurately.
4️⃣ Quantitative-Cum-Qualitative Technique – The Holistic View
📌 This is the most comprehensive technique — combining physical, social, economic and cultural factors.
🧮 Quantitative = measurable things like:
- Rainfall
- Soil type
- Temperature
- Crop yields
🧠 Qualitative = social & cultural things like:
- Land ownership
- Traditions
- Farming practices
- Religious beliefs
📚 Scholars like Baker, Whittlesey, and Carol used this method to identify agricultural regions.
✅ It gives a complete picture
✅ Helps at local, regional, and national levels
❌ Needs a lot of reliable data — which is difficult in many parts of the world
This is like creating a character profile of each agricultural region — not just “what they grow” but also “how, why, and under what conditions”.
🧩 Why No Single Global Method Works?
Despite all efforts, no universal method of agricultural regionalisation exists yet.
Why?
Because:
- Agriculture is dynamic, not static
- Social and climatic conditions keep changing
- Data is often incomplete or unreliable
Even within India, many attempts have been made to classify agricultural regions based on:
- Topography
- Soils
- Water availability
- Cropping patterns
- Agro-economic factors
But each method gives a different result — highlighting the complex and evolving nature of agriculture.
✅ Conclusion: What Should You Remember?
Let’s recap what we have read upto now in simple points and after this we will move on to classification of Agricultural regions in India:
| Key Concept | Summary |
|---|---|
| Region | Area distinguished by specific criteria |
| Agricultural Regionalisation | Dividing land based on farming patterns |
| Purpose | Understand & plan agriculture better |
| Techniques | Empirical, Single Element, Multi-element, Quantitative-Qualitative |
| Ideal Technique | Depends on data, context, and purpose |
| India’s Case | Uses mixed approach considering climate, soil, crops, and economy |
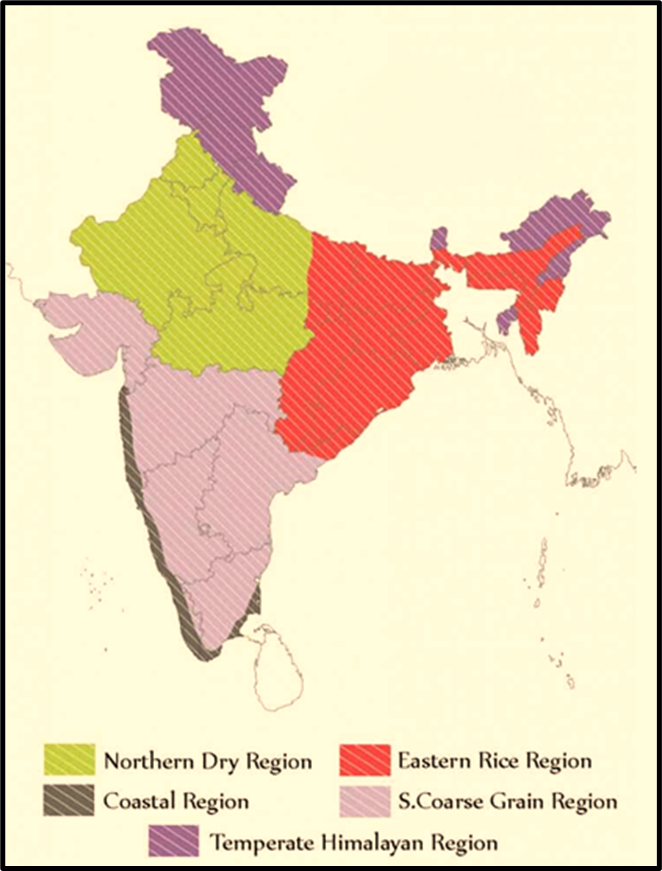
🔶Understanding Randhawa’s Agricultural Regions
So, we can say that agriculture, in its essence, is deeply influenced by geography. Be it rainfall, temperature, soil, or even cultural factors—all leave their fingerprints on the land.
Dr. M.S. Randhawa, a noted agricultural scientist, recognized these differences and divided India into five broad agricultural regions, using climate, crops, and livestock patterns as the core basis.
| Region | States Covered | Rainfall | Major Crops |
|---|---|---|---|
| Temperate Himalayas | J&K, Himachal, Uttarakhand, NE Hills | Moderate to High | Horticulture (fruits), rice, maize |
| Northern Dry (Wheat) | Punjab, Haryana, W. UP, NW MP | < 75 cm | Wheat, maize, mustard |
| Eastern Wet (Rice) | Bihar, WB, Assam, Odisha, UP (east) | > 150 cm | Rice, jute, tea, pulses |
| Western Wet (Malabar) | Maharashtra, Goa, Karnataka, Kerala | > 200 cm | Coconut, spices, rubber |
| Southern Coarse Cereal | Gujarat, MP, TN (west), AP, Karnataka | 50–100 cm | Millets, cotton, groundnut |
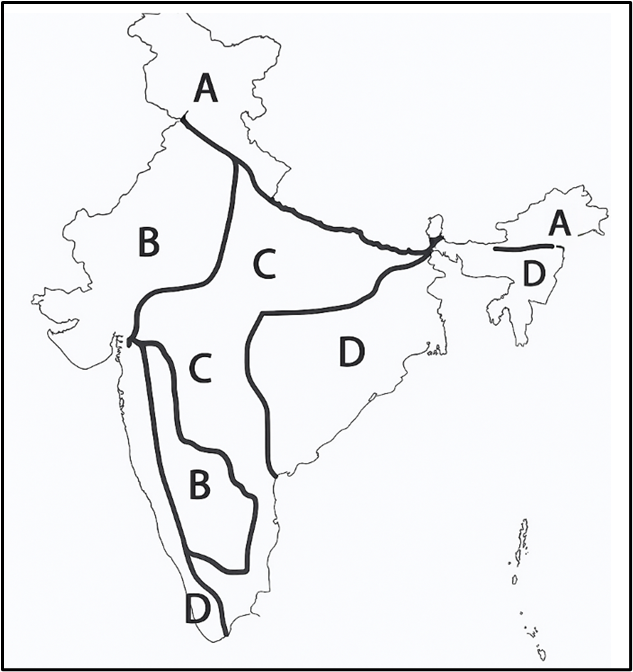
🔶P Sengupta Agricultural Regionalization
In 1968, P. Sengupta, in his book “Economic Regionalization of India”, proposed a three-tier system:
- 4 Macro Agricultural Zones (Large-scale divisions)
- 11 Meso Agricultural Regions (Medium zones)
- 60 Micro Agricultural Units (Smaller, specific areas)
But for UPSC, we’ll focus on the 4 Macro Agricultural Zones, as these give us the big picture.
| Zone | Rainfall | Area Example | Main Crops | Key Feature |
|---|---|---|---|---|
| Himalayan Agricultural Zone | 120–250 cm | J&K, Himachal, Assam Hills | Apples, Tea, Maize | Mountainous; low cultivation |
| Dry Agricultural Zone | ~75 cm | Punjab, Rajasthan, Gujarat | Wheat, Cotton, Oilseeds | Irrigation-dependent productivity |
| Sub-Humid Zone | 75–100 cm | Bundelkhand, Deccan, East Coast | Rice, Wheat, Sugarcane, Tobacco | Potential grows with irrigation |
| Wet Agricultural Zone | 100–125 cm | Chotanagpur, Odisha, Bastar Plateau | Rice, Jute, Coconut, Tea | High rainfall & crop diversity |
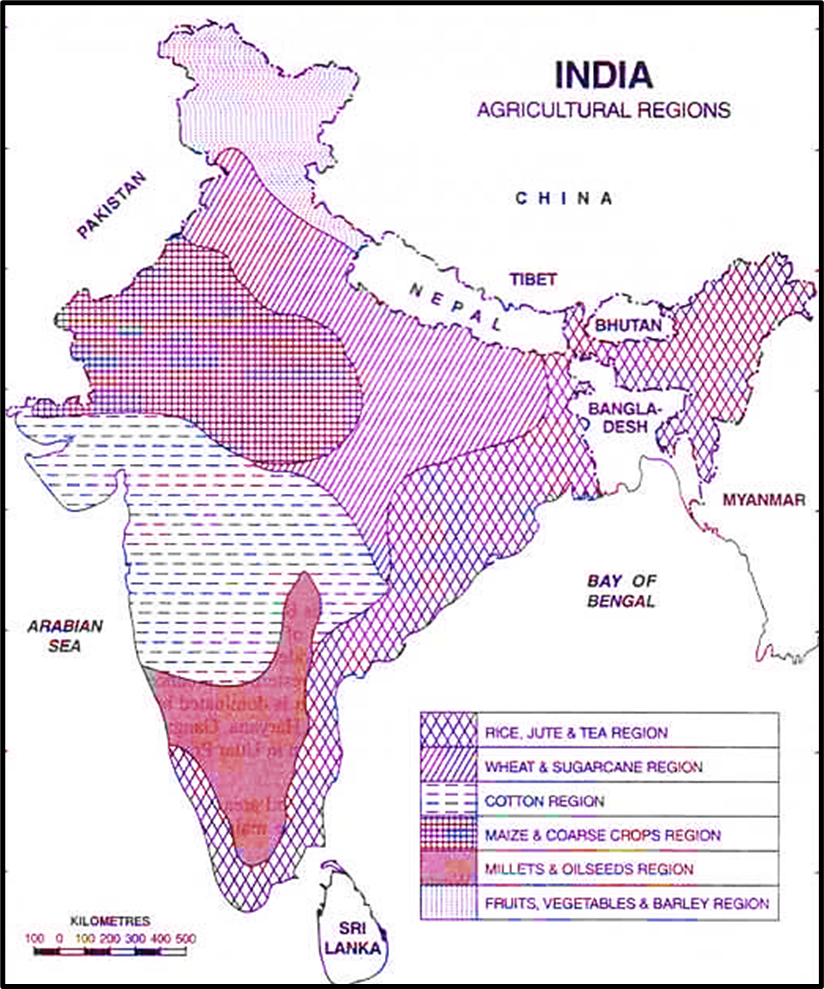
🔶ICAR’s Classification of Agricultural Regionalization
In 1976, the ICAR (Indian Council of Agricultural Research) proposed a practical and crop-centric way of classifying India’s agricultural regions. Unlike climatic or physiographic classifications, this one is directly based on the actual cultivation pattern—what crops dominate and which combinations often appear together.
🔑 KEY CRITERIA:
“Predominance of Crops and Crop Associations.”
That means: What grows the most? Which crops commonly grow together? Based on these associations, India has been divided into six major agricultural regions.
| Region | Dominant Crops | Rainfall (cm) | Major Areas |
|---|---|---|---|
| Rice–Jute–Tea | Rice, Jute, Tea, Horticulture | 180–250 | Assam, Bengal, Odisha, Tarai |
| Wheat–Sugarcane | Wheat, Sugarcane, Rice, Maize | Moderate | Punjab, UP, Bihar, Haryana |
| Cotton | Cotton, Jowar, Gram | 75–100 | Deccan Plateau |
| Maize & Coarse | Maize, Bajra, Pulses | <50 | Rajasthan, Gujarat |
| Millet & Oilseeds | Jowar, Bajra, Groundnut | 75–125 | Karnataka, TN, AP |
| Fruits & Vegetables | Apples, Oranges, Potatoes | 50–200 | Kashmir to Assam |