
Environmental Impacts of Tropical Cyclones
Cyclones are not just “storms.” They are multi-hazard systems that combine:
- Wind destruction
- Heavy rainfall & floods
- Storm surges (sea water rise and inundation)
The damage potential increases with intensity. Let’s try to understand this:
Damage Classification by Cyclone Intensity
| Category | Damage Expected | Measures Required |
|---|---|---|
| Depression / Deep Depression | Minor damage to weak/unsecured structures. | Fishermen advised not to venture into the sea. |
| Cyclone | Damage to thatched huts, breaking of tree branches, minor disruption of power & communication lines. | Suspension of fishing operations. |
| Severe Cyclone | Extensive damage to thatched huts, flooding of escape routes. | Evacuate hutment dwellers to safer places. |
| Very Severe Cyclone | Extensive damage to kutcha houses, minor road/rail disruption, flying debris hazards. | Mobilise coastal evacuations. |
| Extremely Severe Cyclone | Heavy damage to kutcha houses, large-scale power & communication failure, flooding disrupts transport. | Extensive evacuation, diversion/suspension of rail & road traffic. |
| Super Cyclone | Widespread destruction to homes & industries, bridges destroyed, transport paralyzed, sea water inundation of coastal areas. | Mass evacuations, complete suspension of transport & communication. |
👉 Notice the gradation: from minor warnings for fishermen → to total suspension of economic activity in case of super cyclones.
Key Hazards of Cyclones
🌧️ Floods
- Cyclones produce extraordinary rainfall.
- Average: ~50 cm/day common in storm zones.
- Within 50 km radius of the eye → 85 cm/day; at 50–100 km → 35 cm/day.
- Can cross 250 cm/day in extreme cases → catastrophic flooding.
🌬️ Winds
- Very severe & super cyclones = wind speeds high enough to uproot trees, damage houses, knock out power and telecom.
- Example: Odisha Super Cyclone (1999) → winds of 260 km/h (highest on Indian coast in last 100 years).
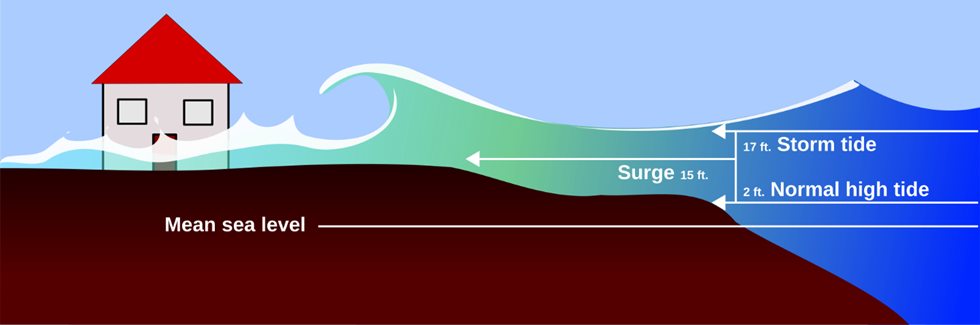
🌊 Storm Surge
- Definition: Abnormal rise of sea level due to cyclone winds piling water near the centre.
- Surge height depends on:
- Intensity of cyclone
- Coastal bathymetry (shallow, funnel-shaped coasts = higher surges).
- Effects:
- Sea water inundates coasts → death, destruction, crop loss.
- Salt deposition makes land unfit for farming for 2–3 seasons.
👉 Storm Tide = Storm Surge + Astronomical Tide.
If cyclone landfall coincides with high tide → destruction multiplies.
Case Studies of Deadly Cyclones
| Cyclone | Category | Region | Fatalities & Impact |
|---|---|---|---|
| 1970 Bhola Cyclone | Extremely Severe Cyclone | West Bengal & Bangladesh | Deadliest in history → 5,00,000+ deaths. |
| 1999 Odisha (Paradeep) Super Cyclone | Super Cyclone (260 km/h winds) | Odisha | Strongest in N. Indian Ocean → 30,000+ deaths, massive destruction. |
| 2008 Nargis Cyclone | Extremely Severe Cyclone | Myanmar (Irrawaddy Delta) | 1,00,000+ deaths, costliest in region. |
👉 Common factor: Maximum fatalities in these cyclones were caused by storm surges, especially in delta regions (flat, low gradient → sea water spreads far inland).
States Vulnerable to Cyclones (India)
🔹 East Coast (more vulnerable than West)
- Severe Cyclonic Storms (SCS): Andhra Pradesh > Tamil Nadu > West Bengal > Odisha > Gujarat.
- Cyclonic Storms (CS): Odisha > Andhra Pradesh > West Bengal > Tamil Nadu > Gujarat.
- Gujarat → Most vulnerable on the west coast.
🔹 Seasonal Pattern
- Peak months: May, October–November.
- Monthly Frequency:
- SCS → November > May > October > December.
- CS → October > November > June.
- Depressions → August > September > July.
👉 Thus, Andhra Pradesh & Odisha face the strongest cyclones, while West Bengal & Bangladesh face deadliest surges.
✅ Quick Revision:
- Damage potential rises with cyclone intensity: Depression → Cyclone → Severe → Very Severe → Extremely Severe → Super Cyclone.
- Hazards include: floods (50–250 cm/day rain), winds (up to 260 km/h), storm surges (inundation + salinity).
- Storm Tide = Storm Surge + Astronomical Tide.
- Case studies (Bhola 1970, Odisha 1999, Nargis 2008) highlight why delta regions are most vulnerable.
- Indian vulnerability: AP & Odisha most exposed; peak months are May & Oct–Nov.
Positive Effects of Tropical Cyclones
We often associate tropical cyclones with destruction — loss of life, property, crops, and infrastructure. But nature is rarely one-sided. Cyclones also play a positive and balancing role in the Earth system.
Let’s look at the major benefits:
1. Heat Balance of the Planet
- The Earth is warming due to greenhouse gases. Oceans store a lot of this heat.
- Tropical cyclones act like natural regulators — by churning up the ocean and releasing heat into the atmosphere.
- This prevents excessive ocean surface warming, which could otherwise damage ecosystems.
- For example: Coral reefs and plankton (primary producers) survive only within a narrow temperature range. Cyclones help keep oceans habitable for them.
👉 Think of cyclones as safety valves of the climate system.
2. Rainfall in Dry & Rain shadow Regions
- Many areas that usually suffer water scarcity suddenly get abundant rainfall during cyclone season.
- Examples:
- Rainshadow of Western Ghats (Telangana, Rayalaseema, Vidarbha, Hyderabad-Karnataka).
- Arid Oman (rainfall here mostly comes from cyclones).
- This rainfall replenishes groundwater, rivers, and soils in otherwise dry areas.
👉 Thus, cyclones redistribute water resources.
3. Breaking up Red Tide
- Red tide = algal bloom → turns coastal waters reddish, depletes oxygen, releases toxins harmful to fish & humans.
- Cyclones, with their winds and wave action, break up these blooms.
- This allows oxygen levels to recover, helping marine life survive.
👉 Cyclones act as “clean-up agents” of oceans.
4. Replenishing Barrier Islands
- Barrier islands (like natural sand embankments) protect coasts from storms and waves.
- Cyclones carry sediment, sand, and nutrients from the ocean bottom → deposit them on these islands.
- This helps rebuild and strengthen coastal landforms.
- Sometimes, storm surges even shift islands closer to the mainland, reshaping coasts.
👉 Cyclones help in the dynamic equilibrium of coastal geomorphology.
5. Seed & Spore Dispersal
- The strong winds of cyclones carry spores and seeds far inland — sometimes thousands of kilometers.
- This helps in:
- Replenishing forests destroyed by fires.
- Natural re-vegetation of urbanised or degraded land.
- In this way, cyclones aid ecological succession and biodiversity recovery.
Tropical Cyclone Scales
Why Do We Need Scales?
Cyclones are not all the same—some are weak and cause minimal damage, while others can be devastating and catastrophic.
👉 To measure and compare their intensity, meteorologists classify them into categories based on wind speed and associated impact.
We will study two systems here:
- Saffir–Simpson Hurricane Wind Scale (International)
- Indian Meteorological Department (IMD) Cyclone Classification
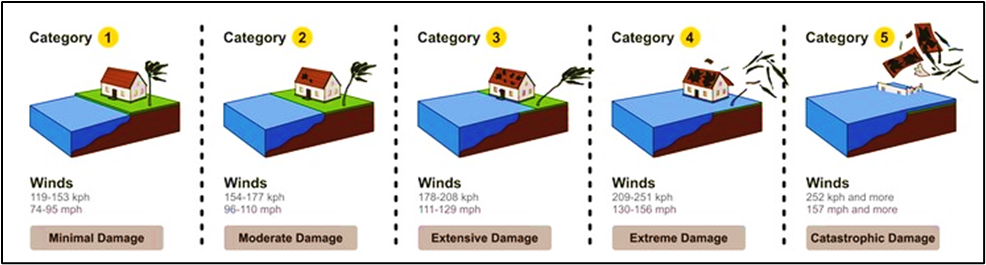
Saffir–Simpson Hurricane Wind Scale
This scale is mainly used for Atlantic and Northeast Pacific hurricanes. It is simple and easy to remember because it divides cyclones into five categories based only on wind speed and their expected damage.
| Category | Wind Speed (kmph) | Damage |
|---|---|---|
| 1 | 120–150 | Minimal |
| 2 | 150–180 | Moderate |
| 3 | 180–210 | Extensive |
| 4 | 210–250 | Extreme |
| 5 | 250+ | Catastrophic |
👉 Notice how the scale grows in steps of ~30 kmph. These values are rounded off to make them easy to memorize.
- A Category 1 storm may uproot small trees,
- But by Category 5, entire settlements can be flattened.
Here is a beautiful video by NOAA illustrating damages caused in each category.
IMD Tropical Cyclone Classification (Indian Context)
The Indian Meteorological Department (IMD) uses a more detailed scale. Unlike the Saffir–Simpson system, it does not stop at five categories but divides storms into seven classes.
Here, classification is based not only on wind speed but also on wave height in the ocean.
| S. No. | Intensity | Wind Speed | Wave Ht. (m) |
|---|---|---|---|
| 1 | Depression (L) | 31–49 kmph (17–27 knots) | 1–4 |
| 2 | Deep Depression (DD) | 50–61 kmph (28–33 knots) | 4–6 |
| 3 | Cyclonic Storm (CS) | 62–87 kmph (34–47 knots) | 6–9 |
| 4 | Severe Cyclonic Storm (SCS) | 88–117 kmph (48–63 knots) | 9–14 |
| 5 | Very Severe Cyclonic Storm (VSCS) | 118–166 kmph (64–89 knots) | 14+ |
| 6 | Extremely Severe Cyclonic Storm (ESCS) | 167–221 kmph (90–119 knots) | 14+ |
| 7 | Super Cyclonic Storm (SuCS) | 222+ kmph (120+ knots) | 14+ |
👉 A few observations:
- Cyclones in the Bay of Bengal and Arabian Sea are usually reported in these terms by IMD.
- Super Cyclonic Storms (SuCS) are the most dangerous category, like the 1999 Odisha Super Cyclone.
- The classification helps not only in forecasting wind damage but also in predicting storm surges (since wave height is included).
Understanding the Unit “Knot”
You often see wind speed written in knots instead of kmph.
- 1 knot = 1 nautical mile per hour.
- 1 nautical mile = 1.852 km.
- So:
1 knot =1.852 kmph ≈0.514 m/s
👉 Simple way to remember:
- Double the knots + add 10% ≈ kmph.
- Example: 30 knots → 30 × 2 = 60, plus ~3 → 63 kmph (close to exact 55.6).
✅ In summary:
- Saffir–Simpson Scale (global) → 5 categories, rounded wind speeds, easy memory, focuses on damage potential.
- IMD Scale (India) → 7 categories, considers both wind speed and wave height, more detailed.