
Patterns and Measurement of Earthquakes
Distribution of Earthquakes – Global Pattern
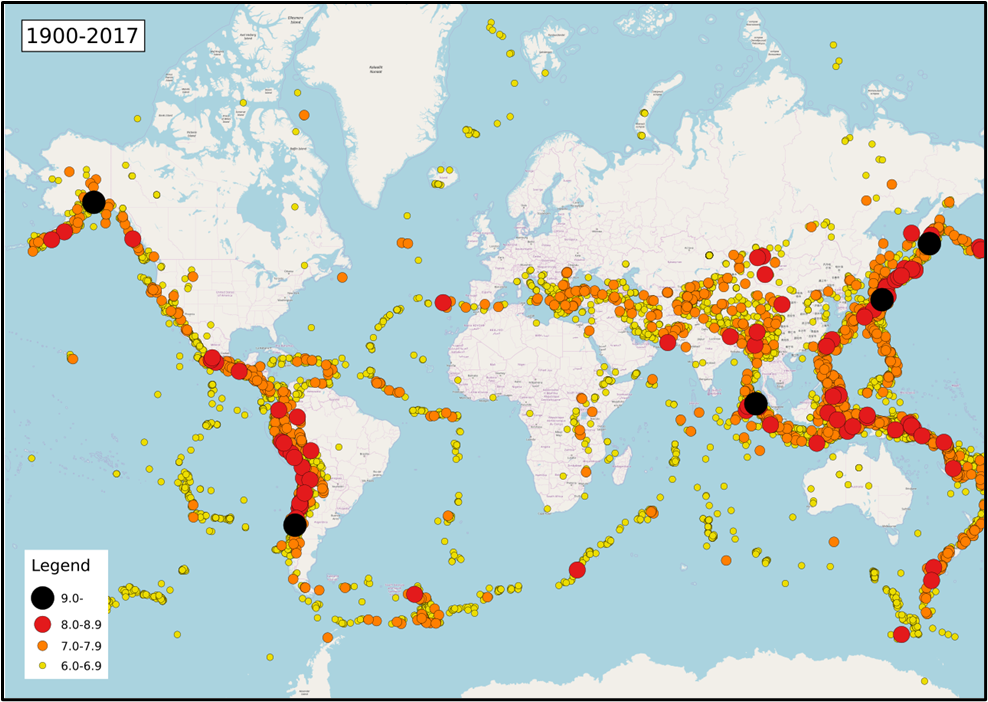
Earthquakes are not scattered randomly across the globe. They are concentrated in certain belts, which largely coincide with the margins of tectonic plates.
In fact, when you plot earthquake epicentres on a world map, they clearly outline the boundaries of plates.
1. The Circum-Pacific Belt (Ring of Fire)
- This is the world’s most important earthquake belt.
- Encircles the Pacific Ocean → hence called the “Ring of Fire.”
- Why this name? Because it is also associated with volcanic activity → a ring of both earthquakes and volcanoes.
👉 Global Share:
- Accounts for about 68% of all earthquakes.
- Also, the majority of the world’s largest and most destructive earthquakes occur here.
👉 Regions included:
- New Zealand and New Guinea,
- Japan, Aleutian Islands, Alaska,
- Western coasts of North America and South America (e.g., Chile, California).
So, from Chile all the way up to Alaska and then down to Japan–Indonesia–New Zealand, this belt forms a fiery horseshoe around the Pacific.
2. The Alpine Belt (Mid-World Mountain Belt)
- Second most important earthquake belt.
- Produces about 15% of the world’s earthquake energy.
- Also called the Mid-World Mountain Belt because it follows the great mountain chains.
👉 Geographical Extent:
- Starts from Mexico, crosses the Atlantic Ocean,
- Passes through the Mediterranean region (Alps, Caucasus ranges),
- Continues into the Caspian region,
- Extends further east into the Himalayas and adjoining lands.
Thus, Alpine Belt links the Alps → Mediterranean → Caucasus → Himalayas.
3. Oceanic Ridge and Rift Valley Belt
Apart from the two main belts, there are other zones of earthquake activity:
- Along mid-oceanic ridges in the Arctic, Atlantic, and Indian Oceans.
- Along rift valleys of East Africa.
👉 Here, earthquakes are usually shallow-focus and relatively less destructive compared to the megaquakes of subduction zones.
✅ Summary Table:
| Earthquake Belt | Share of Earthquakes | Regions Covered | Features |
|---|---|---|---|
| Circum-Pacific Belt (Ring of Fire) | ~68% | Japan, Alaska, W. Americas, NZ, Indonesia | Most powerful, also volcanic activity |
| Alpine Belt (Mid-World Mountain Belt) | ~15% | Alps → Caucasus → Himalayas → SE Asia | Associated with fold mountains |
| Oceanic Ridge & Rift Valley Belt | Remainder | Mid-Atlantic Ridge, Indian Ocean, East Africa | Mostly shallow, less destructive |
💡 UPSC Tip: Whenever “earthquake distribution” is asked in Mains, you should always connect it with plate tectonics (Ring of Fire = convergent margins, Alpine Belt = collision zones, oceanic ridges = divergent boundaries).
Richter Magnitude Scale
- Developed in the 1930s by Charles F. Richter.
- Purpose: To measure the strength of earthquakes, i.e., the amount of energy released.
- Originally called the Local Magnitude (ML) Scale.
👉 However, the Richter Scale had limitations:
- Worked well only for regional earthquakes up to about Magnitude 5.
- For very large earthquakes, it became inaccurate.
Moment Magnitude Scale (Mw) – The Modern Standard
- Today, seismologists use the Moment Magnitude Scale (Mw).
- It is more accurate for large earthquakes.
- In practice, the Mw scale is also referred to as the “Richter Scale” in the media.
👉 Both Richter and Mw scales are logarithmic:
- That means, each whole number increase represents a huge jump in energy.
- 1 step increase = ~32 times more energy.
- 2 step increase = ~1000 times more energy (32 × 32 ≈ 1024).
💡 Example:
- A quake of 7.0 releases 32 times more energy than a quake of 6.0,
- And nearly 1000 times more energy than a quake of 5.0.
Earthquake Magnitudes – Effects & Frequency
Here’s how earthquakes are classified by magnitude, with effects and examples:
| Magnitude | Category | Average Effects | Frequency | Examples |
|---|---|---|---|---|
| 1.0 – 1.9 | Micro | Not felt, only by seismographs | Millions/year | — |
| 2.0 – 2.9 | Minor | Slightly felt, no damage | ~1 million/year | — |
| 3.0 – 3.9 | Minor | Felt by people, no damage | 100,000+/year | — |
| 4.0 – 4.9 | Light | Noticeable shaking, minimal damage | 10,000–15,000/year | Objects may fall off shelves |
| 5.0 – 5.9 | Moderate | Damage to weak buildings, slight to others | 1,000–1,500/year | — |
| 6.0 – 6.9 | Strong | Damage to well-built structures, wide area | 100–150/year | 2011 Christchurch (6.2) |
| 7.0 – 7.9 | Major | Severe damage, collapse possible | 10–20/year | 1819 Rann of Kutch (7.7–8.2), 2001 Gujarat (7.7) |
| 8.0 – 8.9 | Great | Destruction, felt over large regions | ~1/year | 1556 Shaanxi (8.0), 1950 Assam–Tibet (8.6), 2008 Sichuan (8.0), 2010 Chile (8.8) |
| 9.0+ | Catastrophic | Near-total destruction, topography changes | 1 every 10–50 years | 1960 Chile (9.4–9.6), 1964 Alaska (9.2), 2004 Indian Ocean (9.1–9.3), 2011 Tōhoku (9.1) |
Most Powerful Earthquakes Ever Recorded
These belong mainly to the Megathrust category (convergent plate boundaries), where one plate is forced under another.
1. 1960 Valdivia Earthquake, Chile (Mw 9.4–9.6)
- Depth: 33 km → shallow-focus megathrust.
- Most powerful earthquake ever recorded in history.
- Triggered a Pacific-wide tsunami, waves up to 25 m high.
- Death toll: 1,000–7,000 people.
- Affected entire Pacific Rim (Japan, Philippines, New Zealand, Hawaii).
2. 1964 Alaska Earthquake (Mw 9.2)
- Depth: 25 km → shallow-focus.
- Collapsing structures and tsunamis caused 100+ deaths.
- Known as the “Great Alaska Earthquake.”
- Alaska’s landscape was permanently altered (land uplift and subsidence).
3. 2004 Indian Ocean Earthquake (Mw 9.1–9.3)
- Depth: 30 km → shallow-focus megathrust.
- Caused by rupture between Burma Plate and Indian Plate.
- Generated massive tsunamis up to 30 m high.
- Killed 227,000+ people in 14 countries → one of the deadliest natural disasters in recorded history.
- Fun fact: The quake was so powerful it slightly altered Earth’s rotation and shifted its axis.
4. 2011 Tōhoku Earthquake, Japan (Mw 9.1)
- Depth: 30 km.
- Japan’s most powerful earthquake ever recorded.
- Triggered a massive tsunami that caused 15,896 deaths.
- Led to the Fukushima Daiichi nuclear disaster → highlighting how quakes can trigger secondary hazards.
- Economic loss: One of the costliest disasters ever.
Notable Earthquakes in History
Apart from the “Top 4,” certain earthquakes are remembered for their unique impacts.
1. 1556 Shaanxi Earthquake (China) – Magnitude ~8.0
- Deadliest earthquake in recorded history.
- 8,00,000+ fatalities.
- Cause of deaths: Collapse of man-made cave dwellings in loess cliffs (called yaodongs).
2. 1819 Rann of Kutch Earthquake (Magnitude 7.7–8.2)
- Triggered a tsunami in the Arabian Sea.
- Caused >1000 deaths.
- Created:
- Subsidence zone → formed Sindri Lake.
- Uplift zone → 80 km long, 6 km wide, 6 m high → blocked rivers and created a natural dam known as Allah Bund (Dam of God).
3. 2001 Gujarat (Bhuj) Earthquake – Magnitude 7.7
- Depth of focus: 24 km (shallow).
- Casualties: 13,000–20,000 deaths.
- Occurred 400 km inside the Indian Plate, not exactly at the boundary.
- Reason: The collision with the Eurasian Plate has reactivated rift faults in the region, making Gujarat seismically active.
- Historical linkage: The pattern of uplift and subsidence here matches the 1819 Kutch quake → showing continuity of tectonic stress in the region.
One Comment